
Introduction
Wealth mobility is the ability of an individual, family, or household to move up or down the wealth distribution relative to their peers over time. That's it. That's the whole concept, though most people never see it defined this cleanly.
This matters for economists studying inequality, policymakers designing tax policy, financial advisors guiding clients, and anyone trying to build lasting wealth.
Yet "wealth mobility" gets thrown around in headlines constantly, almost always confused with income mobility. They're not the same thing, and mixing them up leads to bad conclusions about how the economy actually works.
This article breaks down the global framework researchers use to measure wealth mobility, the methodology behind it, and the specific factors that move households up or down the wealth ladder.
Key Takeaways
- Wealth mobility tracks net worth rank over time; income mobility tracks earnings, and the two often diverge.
- Researchers measure movement using transition matrices, plus Bartholomew and Shorrocks indices.
- Mobility drops sharply with age: late-20s exit the bottom quintile far more often than late-40s peers.
- Business ownership, real estate, and direct investment assets outperform earned income as mobility drivers.
- Time horizon changes the story: a 1-year study and a 23-year study rarely align.
What Is Wealth Mobility?
Wealth mobility tracks a household's position, whether that's a quintile or a specific percentile, in the net worth distribution compared to same-age peers. The metric focuses on where your assets minus your debts rank against everyone else at a comparable life stage, not on how much you earn.
Researchers split this into two distinct types:
- Intergenerational wealth mobility compares a person's wealth to their parents' wealth at a similar age
- Intragenerational wealth mobility tracks movement within one's own working life
Brookings' Stuck on the Ladder study is the clearest example of intragenerational research. It follows 1,262 PSID participants born between 1948 and 1964, from their early 30s into their late 50s.
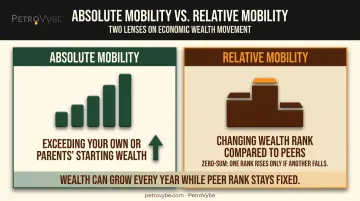
This kind of rank-tracking points to a critical distinction between absolute mobility (exceeding your own starting point, or your parents') and relative mobility (changing rank compared to peers). Only relative mobility is zero-sum. Your wealth can grow every year of your life while your rank among peers stays exactly where it started.
Why Wealth Mobility Is a Critical Global Economic Indicator
Wealth concentration has been climbing for decades. The top 1% of U.S. households held 23.5% of total household wealth in 1989, rising to 31.0% by the end of 2019, according to Federal Reserve data.
That number alone tells you concentration is rising. It doesn't tell you whether the same families stayed at the top the entire time, or whether new households cycled in and out. That's the real question mobility research answers.
A related concept, the "Great Gatsby Curve," shows that countries with higher income inequality tend to have lower intergenerational earnings mobility. The U.S. sits below most Nordic countries, Canada, and Germany on this measure. This curve relies on income data, not wealth data, making it a useful parallel rather than direct proof of wealth stickiness.
Wealth-specific tracking closes that gap. Without it, policymakers can't tell the difference between:
- Temporary inequality that resolves as people age and accumulate assets
- Permanent stratification where starting position locks in outcomes for life
- Partial mobility, where households move up or down within a generation without fully escaping their starting bracket
That distinction shapes everything from tax policy to retirement program design.
The Global Framework & Methodology: How Wealth Mobility Is Measured
At a high level, researchers rank households into wealth quintiles or percentiles at a starting point, then track those same households years later to see how many changed position. Simple in concept. Complicated in execution.
Data Inputs Researchers Rely On
Measuring this requires longitudinal panel data, not one-time snapshots:
| Dataset | Region | What It Tracks |
|---|---|---|
| PSID | U.S. | Multi-decade family panel since 1968, with wealth waves in specific years |
| SIPP | U.S. | Annual interviews, one-year reference periods, good for short-horizon transitions |
| Survey of Consumer Finances | U.S. | Detailed household balance sheets, mostly cross-sectional |
| Norway's tax and wealth registry | Norway | Near-population administrative records, minimal survey attrition |
Building the Transition Matrix
The core methodology involves constructing a transition probability matrix, a table showing the percentage of households moving from each starting quintile to each ending quintile. The diagonal of that matrix represents persistence: households that stayed put.
Two indices summarize this movement. The Bartholomew index weights both the frequency and the size of movement across quintiles, while the Shorrocks index measures "stickiness" using the matrix diagonal, where 0 means complete immobility and 1 means complete mobility.
Findings shift depending on the time horizon studied. A 1-year window shows more statistical noise but reveals early patterns. A 23-year window captures durable accumulation but blends together very different life stages.
The actual research process follows three steps:
- Segment and rank: Divide the population into age cohorts and rank each household within its cohort by wealth percentile at Time A.
- Track forward: Follow the same households to Time B, which might be 1, 10, or 20-plus years later depending on study design.
- Build the matrix: Construct the transition matrix and apply mobility indices to quantify how much movement occurred, and in which direction.
Key Factors That Drive Upward or Downward Wealth Mobility
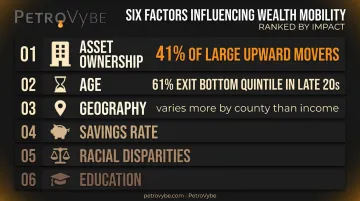
Six variables show up consistently across the research as the biggest drivers of wealth rank change.
- Asset ownership type. Business owners, real estate investors, and other asset holders see far more upward wealth movement than income-only households. But ownership cuts both ways: farm and business ownership shows up in 41% of large upward movers and 51% of large downward movers, versus just 23% of non-movers, per Cleveland Fed research.
- Age. Mobility peaks early and fades fast: 61% of people starting in the bottom quintile in their late 20s exit within a decade, versus 40% starting in their late 40s — a 21-point gap, per Brookings.
- Geography and neighborhood conditions. Where you grow up shapes lifetime outcomes. Wealth mobility varies more by county than income mobility, meaning some cities and suburbs limit wealth-building even where income opportunity looks fine.
- Savings rate and investment returns. "New Money" households climbing into top wealth tiers get there primarily through higher savings rates and better returns on invested capital, not larger starting capital.
- Racial disparities. Black households experience both lower upward mobility from the bottom and higher downward mobility from the top, compared to White households starting at similar positions.
- Education level. A college degree meaningfully cuts the odds of remaining stuck in the bottom wealth quintile across generations.
Common Misconceptions About Wealth Mobility
Three misunderstandings show up constantly in media coverage and casual conversation.
Income mobility and wealth mobility get treated as interchangeable, but they're not. A household can see rising income year over year while remaining wealth-stuck for decades. Income is a flow; wealth is a stock built from accumulated assets minus debts.
"Hard work alone" gets credited as the driver, yet the data tells a different story. Asset class ownership, particularly business and real estate, predicts mobility far more strongly than earned income growth alone.
High absolute mobility gets mistaken for real progress: most people do out-earn their parents in raw dollar terms, which counts as absolute mobility. But rank order among peers can barely move at all — that's stagnant relative mobility, and it's the part news coverage usually glosses over.
Building Your Own Wealth Mobility: What the Data Implies for Investors
The research points to one consistent conclusion: households that own productive, income-generating assets consistently outpace income-only households on wealth rank. Businesses, real estate, direct resource development — the pattern holds across every dataset reviewed.
Why does direct ownership work faster than passive income alone? It combines three things simultaneously:
- Cash flow from ongoing operations
- Appreciation in the underlying asset value
- Deductions that offset active income, not just passive income
That third point matters more than most investors realize. Real estate deductions are typically restricted to passive income only, unless you qualify as a full-time real estate professional. Direct working interests in oil and gas development work differently under the tax code.
PetroVybe's natural gas development model, PetroVybe ONE, fits squarely into this category. Accredited investors get direct equity in upstream development projects in Lavaca County, Texas, not shares in a fund or a royalty check. The structure is built around:
- A historical MOIC target of 2.2x to 5.8x over a 10-year hold
- An IRR near 26% across that same window
- Tax deductions against W-2 and capital gains income through Intangible Drilling Costs, which reduced active income tax liability by 91-94% for partners in recent years
Diversifying beyond stocks, bonds, and a primary residence into asset classes tied to structural economic demand, like natural gas positioned around AI-driven electricity growth, mirrors what mobility researchers found in "New Money" households. These households built wealth through differentiated asset exposure paired with reinvested returns. Learn more about how this structure works at petrovybe.com.

Frequently Asked Questions
What does financial mobility mean?
Financial mobility refers to a household's or individual's ability to change their economic position, whether income or wealth, over time. It can happen within a single lifetime or across generations.
What is global wealth mobility?
Global wealth mobility refers to how wealth rankings shift for individuals or families internationally and across generations. Rates vary widely by country, largely based on each nation's underlying inequality levels.
What is the difference between wealth mobility and income mobility?
Income mobility tracks changes in earnings. Wealth mobility tracks net worth, meaning assets minus debts. Wealth tends to be far "stickier" than income across a person's lifetime.
How is wealth mobility measured?
Researchers build a transition matrix tracking households from a starting wealth quintile to an ending quintile. They then apply mobility indices, such as the Bartholomew and Shorrocks measures, to quantify the movement.
Does wealth mobility increase or decrease with age?
Mobility is highest in early adulthood and drops significantly with age. The odds of exiting the bottom quintile fall substantially between someone's late 20s and late 40s.
What assets are most associated with upward wealth mobility?
Business ownership drives the largest upward wealth movements, with real estate outside a primary residence and other direct investment assets following close behind across research studies.