
Here's the pain point most people miss: they measure wealth by salary. A $400,000-a-year surgeon and a small-business owner clearing $150,000 might look worlds apart on paper, yet the business owner could easily have ten times the net worth. Income is what you earn. Net worth is what you've actually built.
This article breaks down the real national and state-level thresholds for the top 1%, how the bar shifts by age, what actually separates top 1% households from high earners who never get there, and the concrete strategies — including tax-advantaged alternative assets — that help close the gap.
Key Takeaways
- The national top 1% entry point sits in the eight-figure range, median $13M
- Billionaire outliers skew the average net worth up to roughly $38M
- State thresholds swing wildly — under $3M in Mississippi vs. over $21M in Hawaii
- Top 1% wealth stems from business equity, real estate, and financial assets, not paychecks
- Tax efficiency and decades of compounding matter more than a single high-income year
What Does "Top 1%" by Net Worth Actually Mean?
Net worth is simple math: everything you own minus everything you owe. It's a stock measurement (a snapshot of accumulated wealth), not a flow like income, which only counts money moving in during a given period.
That distinction explains why two people earning wildly different salaries can land on opposite sides of the wealth ledger. Consider:
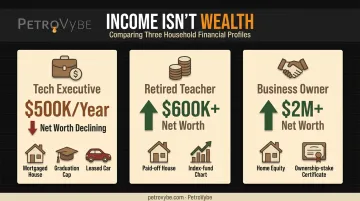
- A tech executive earning $500,000/year with a $1.8M mortgage, $200K in student loans, and a leased car has a net worth far lower than his salary suggests
- A retired schoolteacher with a paid-off home, a modest pension, and $600K in index funds might have less income but a healthier balance sheet
- A small business owner with $2M in home equity, retirement savings, and an ownership stake may draw a modest salary yet carry substantial net worth
How Net Worth Differs From Income
Income measures cash flow. Net worth measures accumulation. Someone earning $960,000 a year in a high-cost city can end up with lower net worth than a debt-free retiree living on $40,000 a year, once taxes, a mortgage, private school tuition, and lifestyle spending are factored in.
The retiree simply spent decades converting income into owned assets instead of ongoing obligations.
This is the core confusion around the "top 1%" label. People assume it's an income club. It's actually a balance sheet club.
The National Top 1% Threshold and Why the "Average" Is Misleading
So what does that balance sheet actually need to look like? Commonly cited estimates put the median net worth needed to enter the top 1% at roughly $13M, while the average is closer to $38M. That $25M gap isn't a rounding error: it reflects a small number of ultra-billionaires pulling the average far above what a typical top 1% household actually holds.
For scale: the median U.S. household net worth sits around $192,700, according to the Federal Reserve's 2022 Survey of Consumer Finances. That means the typical top 1% household holds roughly 65 times the wealth of the typical American family, using the more conservative median figure rather than the inflated average.
Top 1% Net Worth Thresholds Vary Dramatically by State
Geography changes the math. Cost of living, industry concentration, and real estate scarcity all push local thresholds up or down. A household that clears the top 1% bar in Kansas wouldn't come close in Hawaii.
Highest-Threshold States: Where the Bar Is Steepest
Coastal states with land scarcity and concentrated equity wealth top the list:
| State | Top 1% Threshold |
|---|---|
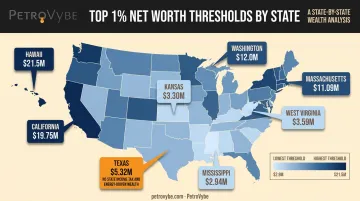
| Hawaii | $21.5M |
| California | $19.75M |
| Washington | $12.0M |
| Massachusetts | $11.09M |
Hawaii's number reflects extreme land scarcity combined with tourism-driven fortunes. California and Washington owe theirs to tech and entertainment equity: stock options and founder shares that compound far faster than salary ever could. Massachusetts follows a similar pattern through biotech and venture capital wealth.
Lowest-Threshold States: Where the Bar Is Most Achievable
At the other end, lower cost of living narrows the gap between a typical household and the top 1%:
| State | Top 1% Threshold |
|---|---|
| Mississippi | $2.94M |
| Kansas | $3.30M |
| West Virginia | $3.59M |
These states share a pattern: lower housing costs and concentrated resource-based fortunes (agriculture, energy, manufacturing) mean the distance between median households and the wealthiest households is simply shorter.
Texas: A Unique Case Study in Energy-Driven Wealth
Texas sits in an unusual middle ground: a $5.32M threshold despite housing nearly a million millionaire households. Two forces explain this.
First, Texas has no state income tax, and voters made a state income tax constitutionally harder to adopt in 2019. Every dollar of investment gain or business income compounds without a state-level haircut.
Second, energy wealth in Texas is concentrated but not exclusive to Houston's energy corridor, Dallas, and the broader Gulf Coast Basin. This same region, spanning South Texas counties like Lavaca County, is where private natural gas and NGL development projects have historically created outsized wealth for early investors.
PetroVybe operates within that same Gulf Coast Basin corridor, targeting the Wilcox formation and structuring its projects around the same tax advantages that have long supported energy wealth-building in Texas.
Texas proves you don't need California's stock-option economy to reach the top 1%. A lower cost of living combined with concentrated, tax-efficient asset ownership gets you there with a smaller number.
Top 1% Net Worth by Age: How the Bar Rises Over a Lifetime
The top 1% threshold isn't static. It climbs sharply through mid-career as business equity and investment portfolios mature.
| Age Range | Est. Top 1% Threshold |
|---|---|
| 18–24 | ~$653,000 |
| 30–34 | ~$2.64M |
| 40–44 | ~$7.84M |
| 45–49 | ~$8.70M |
| 60–64 | ~$17.87M |
| 65–69 | ~$22.10M |
Compare that to what the average American household actually holds at each stage, per the Federal Reserve's 2022 Survey of Consumer Finances:
- Under 35: mean net worth around $183,500
- 45–54: mean around $1.25M
- 65–74: mean around $1.96M
The gap is stark at every stage. Many households under 30 carry negative net worth once student loans and consumer debt outweigh assets.
Closing that gap to the top 1% line doesn't happen through a single bonus or salary jump. It happens through decades of saving, investing, and paying down debt, with the steepest climb occurring between ages 35 and 55 as equity positions mature.
What Separates the Top 1% From Everyone Else
The defining trait of top 1% households is ownership, not a bigger paycheck.
Equities and private business stakes dominate top 1% balance sheets. The wealthiest 1% of Americans own roughly 50.2% of all corporate equities and mutual fund shares in the country, a concentration that explains why the top 1% threshold moves in near lockstep with market cycles. When stocks rally, the bar for entry rises with it.
This ownership pattern also debunks a popular myth. Most people assume top 1% wealth is inherited. The data says otherwise:
- 79% of surveyed millionaires received no inheritance at all, according to Ramsey Solutions' National Study of Millionaires
- Only 3% inherited $1M or more
- 75% attributed their success to regular, consistent investing over a long period
- 8 in 10 invested through an employer-sponsored 401(k)
The takeaway: most top 1% households didn't win a lottery. They built equity positions in businesses, stocks, and real estate, and let them compound for years.
Top-tier households also diversify beyond traditional stocks, bonds, and real estate into tax-advantaged alternative assets, such as direct energy investments that carry substantial upfront tax deductions. Protecting what you've built from taxation is just as important as growing it in the first place.

Strategic Paths to Build Wealth Toward the Top 1%
There's no shortcut, but there is a sequence. Here's how top 1% households actually get there.
1. Build the foundation first.
- Budget with discipline and eliminate high-interest debt
- Max out the 401(k) match, then Roth or Traditional IRA contributions
- Invest consistently in low-cost index funds rather than timing the market
2. Own equity, not just a salary. Business ownership and equity stakes are the single biggest accelerant separating the top 1% from high earners who only draw a paycheck. A W-2 salary, no matter how large, is a flow that stops the moment you stop working. Equity keeps compounding whether you show up or not.
3. Treat taxes as a wealth multiplier. Every dollar saved from taxes is a dollar that keeps compounding instead of disappearing. High W-2 earners and investors sitting on large capital gains often lose the most ground to taxation, making them the group with the most room to benefit from strategic deductions.
4. Diversify into tax-advantaged alternative assets. This is where most portfolios stop short. Beyond stocks, bonds, and real estate, private oil and natural gas development offers a genuinely rare tax mechanism: Intangible Drilling Cost (IDC) deductions. Unlike most real estate deductions, which typically offset only passive income, IDCs offset active income, including W-2 wages and capital gains.
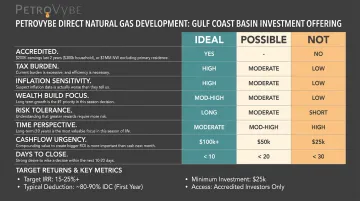
PetroVybe gives accredited investors direct access to early-stage natural gas development in South Texas and the Gulf Coast Basin, with disclosed targets that include:
- A 10-year target MOIC of ~2.2x to 5.8x
- A 10-year target IRR near 26%
- First-year deductions of roughly 70% against active income, with 2024 partners realizing 94% and 2025 partners realizing 91%
- A $100,000 minimum investment, open only to verified accredited investors
5. Give it time. Most top 1% wealth is built over 20 to 30-plus years of patient compounding, not a single windfall year. Strategy and time matter more than any single high-paying job ever will.
Frequently Asked Questions
What is a top 2% net worth?
The top 2% threshold sits just below the top 1% figure, generally in the high seven-to-low eight-figure range nationally, though it varies by state. This represents households in the 98th percentile of net worth.
What is the average net worth of the 1%?
The average net worth of the top 1% is around $38 million, but the median is closer to $13 million. A small number of ultra-billionaires skew the average sharply upward.
What net worth is considered "rich" in the US?
"Rich" is subjective and depends heavily on your reference group. Many analysts use $1M+ as a "mass affluent" starting point, scaling up through the multi-million-dollar top 1% threshold depending on your state.
Does the top 1% net worth threshold include home equity?
Yes. Net worth calculations typically include primary residence equity along with investments, business ownership, and other assets, minus all liabilities like mortgages and loans.
How is net worth different from income?
Income is money earned over a period, while net worth is the accumulated value of everything you own minus everything you owe. High earners can still have low net worth if they carry heavy debt.
Can someone reach the top 1% without a high salary?
Yes. Many self-made top 1% households built wealth through business ownership, disciplined long-term investing, and tax-advantaged strategies rather than relying on an exceptionally high salary alone.