
Many investors assume diversification alone protects their wealth. In reality, optimization is a rigorous, quantitative process, one that weights each holding to maximize return for every unit of risk taken on.
This guide breaks down the core optimization models institutions use, a step-by-step framework you can apply today, and the alternative asset and tax strategies accredited investors use to squeeze more after-tax, inflation-adjusted return out of every dollar deployed.
Key Takeaways
- Optimization weights assets for the best risk-adjusted return, not just diversification
- MPT, Black-Litterman, and Monte Carlo models map your personal efficient frontier
- Rebalancing and monitoring are ongoing disciplines, not one-time events
- Alternatives and tax-advantaged structures lift after-tax returns beyond stocks and bonds
- Behavioral biases and stale historical data undermine even well-built portfolios
What Is Investment Portfolio Optimization?
Portfolio optimization is the quantitative process of selecting and weighting assets to build a portfolio that delivers the best possible return for a given level of risk. Flip the objective and the same math applies to minimizing risk for a given return target. It's math applied to money, not guesswork dressed up as strategy.
The concept traces back to Harry Markowitz's 1952 Modern Portfolio Theory, which introduced the efficient frontier: a curve representing portfolios that offer the highest expected return for each level of variance. Anything below that curve is leaving return on the table for the risk you're already taking.
The impact of this discipline shows up in the data. Research using NYSE and AMEX data from 1968 to 1998 found that a constrained minimum-variance portfolio produced roughly 12% annualized volatility, compared to 17% for an equal-weighted portfolio holding the same assets. That comparison comes from research published by the National Bureau of Economic Research. Same universe of stocks, dramatically different risk profile.
Portfolio Optimization vs. Diversification vs. Asset Allocation
These three terms get used interchangeably, but they describe different layers of the same process:
- Diversification spreads capital across multiple holdings to reduce single-asset risk
- Asset allocation divides capital among broad categories like equities, bonds, and alternatives
- Optimization mathematically fine-tunes the exact percentage weight of each asset within those categories
These layers build on each other. Diversification supplies the raw materials. Asset allocation works as the blueprint. Optimization is the precision engineering that calculates exact weights so the structure holds up under real market stress.
For investors already spread across equities and bonds, that optimization work increasingly extends to alternative assets like direct energy development partnerships, which don't move in lockstep with public markets.
Why Risk-Adjusted Return Matters
Two portfolios can post identical 10% returns and still be nowhere near equally attractive. One might have gotten there with steady 8% volatility; the other might have swung wildly through 20% drawdowns to arrive at the same number.
That's why professionals lean on risk-adjusted metrics:
- Sharpe ratio: excess return over the risk-free rate, divided by total volatility
- Treynor ratio: excess return divided by beta, useful for well-diversified portfolios where systematic risk dominates
- Sortino ratio: excess return divided by downside deviation only, ignoring the upside swings investors don't mind
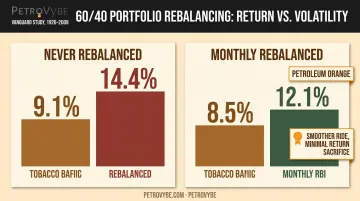
Raw returns alone can mislead. In a well-known 1926-2009 study of a 60/40 portfolio, Vanguard found that a never-rebalanced portfolio posted a higher raw annualized return of 9.1%, but with 14.4% volatility as equity drift pushed risk exposure upward. A monthly-rebalanced version returned 8.5% at just 12.1% volatility — a materially smoother ride for a small return sacrifice.
Top Portfolio Optimization Strategies & Models
No single model works for every investor. The right choice depends on your goals, the quality of data available, and how much complexity you're willing to manage.
Modern Portfolio Theory & Mean-Variance Optimization
Markowitz's original premise: combine assets with low correlation to each other, and the combined portfolio's risk drops below the average risk of its individual pieces. Mean-variance optimization (MVO) tests different weightings across a set of assets to locate the mix sitting on the efficient frontier.
The catch is input sensitivity. Small changes in expected return assumptions can swing the "optimal" weights dramatically, which is why constrained or shrinkage-based versions tend to perform more reliably out-of-sample than textbook MVO.
Black-Litterman Model
Developed at Goldman Sachs, this model starts with market-equilibrium returns implied by the CAPM, then blends in the investor's own views on specific assets or sectors, weighted by how confident they are in those views. The result: more intuitive, stable allocations than raw MVO tends to produce, which is a big part of why institutional advisors favor it.
Monte Carlo Simulation
Rather than forecasting one expected outcome, Monte Carlo simulation runs thousands of randomized return scenarios based on defined probability distributions. Instead of "your portfolio will return 7%," you get a range: for example, a 70% probability of hitting your retirement goal, or a 15% chance of a significant shortfall. The output is a probability map, useful for stress-testing goals against real-world uncertainty.
Risk Parity
Traditional allocation assigns equal dollar amounts. Risk parity assigns equal risk contribution instead. Since bonds and low-volatility assets contribute less risk per dollar than equities, they often receive larger weights, sometimes paired with leverage to hit a target return.
Here's how the four models stack up at a glance:
| Model | Core Approach | Best Fit |
|---|---|---|
| MVO | Balances risk and return using historical correlations | Investors comfortable with quantitative inputs |
| Black-Litterman | Blends market equilibrium with investor views | Advisors seeking stable, intuitive allocations |
| Monte Carlo | Simulates thousands of return scenarios | Investors who want probability ranges, not single forecasts |
| Risk Parity | Allocates by risk contribution, not dollar amount | Investors prioritizing balanced risk exposure |
A shared limitation across all four models: they lean heavily on historical data and statistical assumptions that may not hold in future regimes. Proper implementation of any of these typically requires professional expertise or dedicated optimization software, not a spreadsheet built over a weekend.
How to Optimize a Portfolio: A Step-by-Step Process
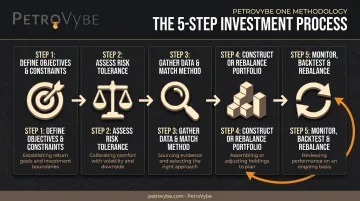
Optimization is a repeatable process, not a one-time calculation.
Define objectives and constraints. Clarify your time horizon, liquidity needs, and expected transaction costs before picking a method. A 30-year-old accumulating wealth has different constraints than a retiree drawing income.
Assess risk tolerance, both financial and psychological. How much drawdown can your balance sheet absorb, and how much volatility can you personally stomach without abandoning the plan mid-decline?
Gather data and match a method to your goals. MVO suits investors comfortable with quantitative modeling; Black-Litterman suits those who want to blend market data with their own convictions.
Construct or rebalance the portfolio. Set target allocations across equities, fixed income, and alternatives, then select individual holdings within each sleeve.
Monitor, backtest, and rebalance on a schedule. Vanguard's analysis of the 1926-2009 period found annual rebalancing produced 8.6% return with 83 trades. A 5-percentage-point drift-threshold approach matched that return using only 28 trades, proving that more frequent trading adds cost without improving results.
Diversifying Beyond Stocks & Bonds: The Role of Alternative Investments
The classic 60/40 portfolio is under real strain. Stock-bond correlations used to run negative, providing a natural hedge when equities dropped.
That hedge has broken down:
- Pre-2021: Correlations ran negative, cushioning portfolios during market downturns
- 2021-2024: Correlations turned positive and stayed above 0.5, according to Morningstar's analysis of inflation's impact on correlations
- The result: Bond prices and equity valuations now often fall together when rates rise, precisely when investors need diversification most
Alternative assets offer a way to rebuild that missing correlation cushion. Real estate, commodities, and private energy development all sit largely outside public market cycles, the same low-correlation principle underlying Markowitz's MPT. It's simply applied to a different asset class.
PetroVybe's South Texas and Gulf Coast Basin projects illustrate this in practice. Direct natural gas development gives accredited investors a tangible asset position rather than a derivative one:
- Minimum investment of $100,000, exclusive to accredited investors
- Projected 10-year MOIC of ~2.2x to 5.8x and IRR of approximately 26%
- Monthly passive distributions projected to exceed $10,000/month during peak production
- Returns tied to production outcomes and proved reserves (a $48 million PV-9 valuation, independently engineered), not stock market sentiment
For investors already holding public equities and bonds, an allocation like this adds a low-correlation, cash-flowing asset class that moves on drilling results and commodity fundamentals rather than the S&P 500's daily swings.
Tax-Efficient Optimization & Common Mistakes to Avoid
After-tax returns determine how much of your gains you actually keep.
Tax-Smart Optimization Strategies
Two well-documented approaches reduce tax drag:
- Tax-loss harvesting: sell below-basis holdings to offset gains (and up to $3,000 of ordinary income) while maintaining market exposure. Vanguard modeled 0.47% to 1.27% in annual after-tax alpha over 15 years.
- Asset location: placing tax-inefficient assets like bonds inside tax-advantaged accounts. Vanguard estimated this adds 5 to 30 basis points of after-tax value annually.
Beyond retirement accounts, accredited investors sometimes turn to direct participation programs for a more aggressive lever. PetroVybe's structure, for example, allows partners to deduct intangible drilling costs (IDCs) directly against active income, including W-2 wages and capital gains, not just passive income as most real estate deductions require.
In 2024, PetroVybe partners captured a 94% deduction against active income; in 2025, that figure was 91%. On a $100,000 investment, that's a deduction in the $90,000-plus range in year one alone.
Common Mistakes That Undermine Optimization
Even a mathematically sound portfolio can fail in practice:
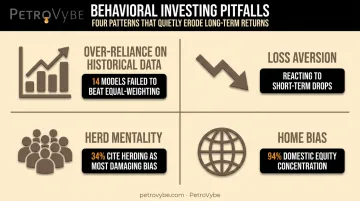
- Over-reliance on historical data. Backtested models often use mild historical scenarios and miss tail risk. One influential study found 14 optimized models across seven datasets failed to consistently beat a simple equal-weighted portfolio out-of-sample.
- Loss aversion. Investors who check portfolios frequently tend to react to short-term drops by fleeing volatile assets, locking in losses that a longer time horizon would have absorbed.
- Herd mentality. In a CFA Institute survey, 34% of respondents named herding as the behavioral bias most damaging to investment decisions.
- Home bias. French and Poterba found domestic equities made up over 94% of the average US investor's equity portfolio, far above global market weights, largely due to overconfidence in familiar markets.
Frequently Asked Questions
What is the 40-40-20 rule in investing?
It's an informal allocation guideline, typically 40% stocks, 40% bonds or fixed income, and 20% alternatives or cash. This isn't a formal academic model, so adjust the split to match your own risk tolerance.
What are the 4 P's of investment management?
Philosophy, Process, People, and Performance form a due-diligence framework advisors use to evaluate investment managers and strategies. It's an industry convention rather than a mathematical rule.
What is the 10/5/3 rule of investment?
A planning heuristic estimating long-term average annual returns: roughly 10% for stocks, 5% for bonds, and 3% for cash. It sets realistic expectations, not a guaranteed outcome.
How often should I rebalance my portfolio?
Most professionals rebalance quarterly to annually, or whenever an asset class drifts more than about 5 percentage points from its target weight. Frequency matters less than consistency.
Is portfolio optimization only useful for large institutional investors?
No. Institutions use advanced software, but individual and accredited investors can apply the same principles through simplified models, robo-advisors, or direct alternative asset allocations.
What role do alternative investments play in portfolio optimization?
Alternatives with low correlation to public markets, such as private real estate or direct energy development, improve diversification beyond what a standard stock-bond mix offers. They also strengthen risk-adjusted returns over the long run.