
Here's the catch many investors miss: "risk-free" doesn't mean risk-free from everything. It means free from default risk. Inflation still chips away at your purchasing power. Reinvestment risk still applies when your bond matures and rates have shifted. A lot of portfolios get built on a misunderstanding of what that word "risk-free" actually promises.
This guide breaks down what risk-free assets are, how they work, and which instruments qualify. We'll also look at where they fit next to growth-oriented, tax-advantaged alternatives in a portfolio built for the long haul.
Key Takeaways
- A risk-free asset offers a virtually guaranteed return, with T-bills as the classic example.
- The risk-free rate is the benchmark used to price every other investment's risk premium.
- Inflation and reinvestment risk still apply — no asset is free of all risk.
- T-bills, TIPS, and FDIC-insured deposits each carry different tradeoffs despite their shared safety label.
- Modest risk-free returns push many investors toward tax-efficient growth assets to protect purchasing power.
What Is a Risk-Free Asset?
A risk-free asset is an investment that offers a secure, virtually certain return with no meaningful chance of default. The textbook example is the U.S. Treasury bill, a short-term debt instrument backed by the full faith and credit of the U.S. government.
That backing is what makes the "risk-free" label stick. The U.S. government controls its own currency and taxing authority, so the odds of it failing to pay back a 13-week loan are treated as effectively zero.
This is also where the risk-free rate comes in. It's the nominal return an investor expects from holding this asset over a given period, and it forms the baseline for how every other investment gets priced:
Expected return = risk-free rate + risk premium
Every stock, corporate bond, or real estate deal you evaluate gets measured against this baseline. If Treasury bills yield 4%, an investment needs to offer something meaningfully above that to justify its added risk.
Why "Risk-Free" Doesn't Mean Zero Risk
Default risk is eliminated for sovereign debt of a stable government, but other risks remain. A 2022 Federal Reserve paper explicitly describes Treasury securities as a proxy for a nominally risk-free asset, not an inflation-proof one.
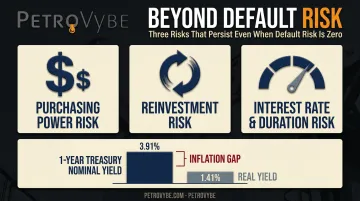
Three risks persist even when default risk is zero:
- Purchasing power risk: Inflation quietly erodes real returns even when nominal yields look attractive.
- Reinvestment risk: Once your T-bill matures, you may have to reinvest the proceeds at a lower prevailing rate.
- Interest rate and duration risk: Selling before maturity exposes you to price swings tied to changing rates.
Consider the gap between nominal and real (inflation-adjusted) yields: as of June 2026, the 1-year Treasury yield sat at 3.91% nominal versus an estimated 1.41% real. That gap is the bite inflation takes out of your stated return, even on an instrument with zero default risk.
The "risk-free" label only holds if you hold to maturity.
Types of Risk-Free (and Near-Risk-Free) Assets
Not every "safe" asset works the same way mechanically. Here's how the main categories break down:
| Instrument | Maturity Range | Key Mechanism |
|---|---|---|
| Treasury bills | 4–52 weeks | Short-term, sold at a discount, standard risk-free proxy |
| Treasury notes | 2–10 years | Intermediate-term, fixed coupon |
| Treasury bonds | 20–30 years | Long-term, fixed coupon |
| TIPS | 5, 10, or 30 years | Principal adjusts with CPI inflation |
| FDIC-insured deposits | Varies (demand to term) | Covered up to $250,000 per depositor, per bank, per ownership category |
Short-term T-bills specifically serve as the standard risk-free proxy because their brief maturity window minimizes interest rate exposure: there's almost no time for rates to move before the bill matures.
TIPS solve a different problem. Their principal rises with the Consumer Price Index and falls with deflation, with a floor guaranteeing you get back at least the original principal at maturity. That's a version of "risk-free" that also addresses purchasing power risk directly, something a plain T-bill doesn't do.
Beyond government securities, bank deposit products (savings accounts, money market deposit accounts, CDs) work through insurance rather than sovereign backing. FDIC coverage caps at $250,000 per depositor, per insured bank, per ownership category. That's a per-relationship limit, not a blanket ceiling across every account you hold.
Foreign sovereign equivalents exist too. German Bunds function as the euro area's main de facto safe asset, and Japanese government bonds serve as Japan's benchmark bond. Both are treated as risk-free in their own currency, though currency risk applies for a U.S.-based investor holding either.
Two categories often get lumped in with risk-free assets but shouldn't be:
- Money market funds are not FDIC-guaranteed. They can lose money: the Reserve Primary Fund famously "broke the buck" in 2008, falling to $0.97 per share.
- Municipal bonds carry real credit and liquidity risk tied to the issuing government's finances, despite their reputation for safety.
- Agency bonds like Fannie Mae and Freddie Mac debt carry only implicit government backing, not the explicit guarantee behind Treasuries.
Gold, equities, and commodities don't belong in this conversation at all. Their future value isn't fixed: a T-bill has a guaranteed, contractual payout, while gold's price can swing wildly.
How Risk-Free Assets Impact Investment Returns
Beyond serving as a safe parking spot for cash, the risk-free rate functions as the foundation every other return calculation in finance sits on top of.
The Risk Premium and Sharpe Ratio
Investors demand extra return above the risk-free rate to compensate for taking on additional risk: that spread is the risk premium, and it's what most expected-return models are built around.
The Sharpe ratio puts this into a practical, comparable number:
Sharpe ratio = (portfolio return − risk-free rate) ÷ standard deviation of returns
In plain terms, it measures how much excess return you're earning for every unit of volatility you take on. Two portfolios might both return 10%, but the one with a higher Sharpe ratio got there with less bumpiness along the way.
Reinvestment Risk in Practice
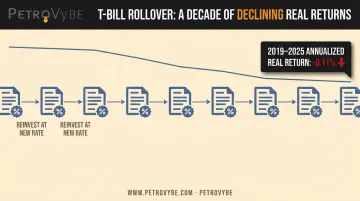
Say an investor rolls six-month T-bills over a ten-year stretch. Each individual bill carries no default risk. But the rate earned on each new bill can differ from the last one. If rates fall between rollovers, that investor's income stream shrinks even though nothing ever "defaulted."
This isn't a theoretical concern. CFA Institute's research on U.S. Treasury bill returns shows an annualized real return of -0.11% for U.S. bills from 2019 to 2025 — meaning bill holders, on average, lost ground to inflation over that stretch despite never facing a missed payment.
The Structural Role: Capital Allocation Line
Risk-free assets also anchor how portfolios get built in the first place. Combining a risk-free asset with a risky portfolio produces what's known as the Capital Allocation Line (a menu of risk/return combinations available to an investor depending on how much of each they hold). This is the mechanical reason financial advisors talk about risk-free assets as a "baseline" rather than just a safe place to hide.
Pros and Cons of Risk-Free Assets
Risk-free assets earn their name from safety, not from being free of trade-offs.
Pros:
- Capital preservation with essentially no default risk
- Predictable liquidity for near-term cash needs
- Function as the pricing benchmark for every other investment class
Cons:
- Historically low nominal yields, often lagging inflation
- Real purchasing power erosion over time, even without a stated loss
- Opportunity cost versus growth-oriented assets over long horizons
Best use cases include emergency funds, short investment horizons, and capital preservation needs close to retirement or a planned major expense. If you need the money in eighteen months, a T-bill ladder makes more sense than a volatile growth position.
Beyond Risk-Free Assets: Balancing Safety With Tax-Advantaged Growth
Here's the part that's easy to overlook: over-allocating to risk-free assets in a high-inflation, high-tax environment can quietly erode long-term wealth, even though no dollar value is ever technically "lost." The account balance goes up. What it can actually buy goes down.
This is why many accredited and high-income investors deliberately pair a risk-free anchor with select alternative asset classes offering inflation-linked upside and tax efficiency. Natural resource development is one example that fits this description.
PetroVybe's natural gas development projects illustrate this tradeoff. These are not risk-free instruments — investor capital is subject to loss, and the structure requires accredited investor status. But the mechanics are engineered around a specific gap that pure risk-free allocations leave open:
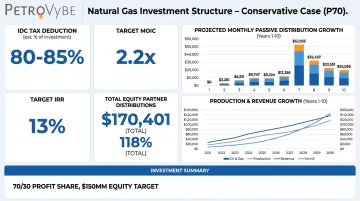
- Upfront tax deductions against active income (W-2 earnings and capital gains) through Intangible Drilling Cost (IDC) deductions: partners received a 94% deduction in 2024 and 91% in 2025
- Long-term MOIC targets of roughly 2.2x to 5.8x over a 10-year hold period, with a targeted IRR near 26%
- Monthly passive distributions projected to peak above $10,000 during the production phase
Unlike real estate deductions, which are typically restricted to passive income under IRS passive loss rules, IDC deductions apply directly against active income for qualifying investors. That's a structural distinction, not a marketing point.
None of this replaces a risk-free base. A $100,000 minimum, accredited-investor-only structure with a multi-year hold period isn't appropriate for money you'll need next quarter. It's a tool for offsetting the purchasing-power drag that comes from holding too much in T-bills or savings accounts for too long.
Talk to a financial or tax advisor before deciding how much to allocate to a risk-free base versus higher-return, tax-advantaged alternatives. The right split depends on your liquidity needs, timeline, and how much volatility you can actually tolerate, not just on paper but in practice.
Frequently Asked Questions
What is a risk-free asset?
A risk-free asset is an investment with a virtually guaranteed return and no meaningful default risk. Short-term U.S. Treasury bills are the standard example, backed by the full faith and credit of the government.
What is the most risk-free asset?
Short-term U.S. Treasury bills are widely considered the most risk-free asset available. Their backing by the U.S. government's full faith and credit makes default risk essentially negligible.
Is gold a risk-free asset?
No. Gold's market price fluctuates constantly, and its future value is never guaranteed the way a T-bill's fixed payout is. Gold's price can swing several percentage points in a single week, a volatility level fundamentally incompatible with a "risk-free" label.
Are risk-free assets a good hedge against inflation?
Standard risk-free assets like T-bills often lag inflation, sometimes producing negative real returns for years at a time. TIPS are specifically designed to offer inflation protection through CPI-adjusted principal.
What is the difference between the risk-free rate and a risk-free asset?
The risk-free asset is the actual instrument, such as a T-bill. The risk-free rate is the return that instrument generates, used as the benchmark for pricing risk on everything else.
Can a risk-free asset ever lose money?
Default risk is essentially eliminated, but investors can still experience a real, inflation-adjusted loss in purchasing power. Selling before maturity can also produce a paper loss if interest rates have moved against you.