
That's where many investors get tripped up. They confuse a headline "return" figure with real, distributable cash flow, then wonder why two deals with similar marketing decks perform so differently once the money starts (or doesn't start) hitting their bank account.
Cash-on-Cash (CoC) return solves that confusion. This article breaks down what it means, how to calculate it step by step, when it's genuinely useful, where it falls short, and how the same logic applies to alternative income assets like oil and gas development.
Key Takeaways
- CoC return measures annual pre-tax cash flow relative to cash invested, as a percentage
- It's a levered, single-period snapshot, not a measure of total profitability or appreciation
- Investors commonly benchmark 8%-12%, though the right number depends on strategy and market
- Pair CoC with IRR, Equity Multiple, or MOIC for a complete investment picture
- The same cash-flow-to-investment logic applies to real estate, private funds, and energy development projects
What Is Cash-on-Cash Return?
Cash-on-cash return is the annual pre-tax cash flow an investment generates, divided by the total cash actually invested. J.P. Morgan's commercial real estate team frames it this way, and the Urban Land Institute describes it similarly as a return on equity: cash flow before taxes divided by total equity invested.
That distinction matters. CoC is a levered metric in most cases, because it accounts for debt service and measures return against the equity an investor actually put down, not the full purchase price. Contrast that with an unlevered, "free-and-clear" return, which ignores financing entirely. If a deal is purchased with all cash, CoC and the unlevered return become identical.
Investors reach for this metric in a handful of common scenarios:
- Evaluating a rental property before closing
- Comparing monthly distributions across private funds, from real estate to oil and gas partnerships
- Assessing any income-producing asset with recurring payouts
CoC vs. ROI: Not the Same Thing
People often use "return" loosely, but CoC and ROI answer different questions. ROI captures the full picture: appreciation, loan paydown, and eventual sale proceeds. CoC doesn't. It measures only the cash yield on invested capital during a given period. Still, a property with a mediocre CoC can deliver a strong ROI if it appreciates significantly.
Total cash invested typically includes:
- The down payment
- Closing costs
- Any upfront capital contributions or improvement costs
Skip any of these, and the resulting percentage overstates an investor's real return.
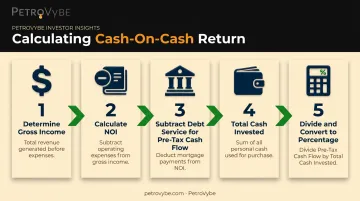
How to Calculate Cash-on-Cash Return (Step by Step)
The core formula:
CoC Return = Annual Pre-Tax Cash Flow ÷ Total Cash Invested
Getting there requires a few sequential steps.
- Determine gross income. This is rental income or other recurring revenue the asset produces before any deductions, such as total lease payments collected in a year.
- Calculate Net Operating Income (NOI). Subtract operating expenses, including property taxes, insurance, maintenance, and management fees, from gross income.
- Subtract debt service to find pre-tax cash flow. Take NOI and subtract annual loan payments (principal plus interest). What's left is your pre-tax cash flow.
- Total the cash invested. Add the down payment, closing costs, and any initial capital or improvement costs.
- Divide and convert to a percentage. Pre-tax cash flow divided by total cash invested, multiplied by 100.
A Worked Example
J.P. Morgan illustrates this well: picture a $6 million property financed with $2 million of equity and a $4 million loan.
- Annual NOI: $400,000
- Annual debt service: $200,000
- Pre-tax cash flow: $400,000 - $200,000 = $200,000
- CoC return: $200,000 ÷ $2,000,000 = 10%
Buy that same property entirely with cash, and there's no debt service to subtract. Pre-tax cash flow stays at $400,000, but it's measured against the full $6 million, producing a 6.7% return. Same asset, same income, very different CoC depending on how it's financed. The same math applies whether you're evaluating a rental property or a stake in an oil and gas development project — only the inputs change.
Common mistakes to avoid:
- Forgetting to net out vacancy losses before calculating NOI
- Using post-tax cash flow instead of pre-tax figures
- Leaving closing costs or improvement costs out of the "total cash invested" figure
- Comparing a levered CoC against an unlevered cap rate as if they're interchangeable
Why Cash-on-Cash Return Matters — and Its Limitations
CoC earns its place in an investor's toolkit when the priority is steady, near-term cash distributions rather than long-term appreciation. Retirement investors and income-focused buyers lean on it heavily for exactly this reason: it answers "what am I getting paid this year?"
It's far less useful for value-add or flip strategies. If most of the projected return comes from a future sale or repositioning rather than ongoing operations, a CoC snapshot tells you almost nothing about whether the deal will actually work out.
Where the Metric Can Mislead
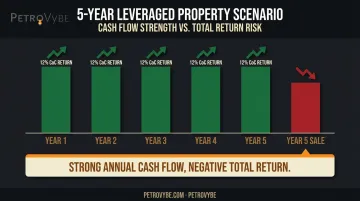
Here's the blind spot worth sitting with: a high CoC return in any single year can mask a weak overall outcome. Imagine a heavily leveraged property posting a strong 12% CoC every year for five years, then selling into a soft market at a price below the original purchase price.
The annual cash flow looked great the entire time, but the investor still lost money on a total-return basis. CoC never accounted for the declining exit value or the time value of money, precisely the scenario Internal Rate of Return (IRR) is built to catch.
The Urban Land Institute goes as far as calling single-number metrics like cap rate and CoC "blunt instruments" in its report on real estate investment fundamentals, noting they fail to capture cash-flow fluctuations, leverage effects, or appreciation over a full hold period.
Key limitations to keep in mind:
- Ignores property or asset appreciation entirely
- Doesn't account for the time value of money
- Reflects pre-tax figures, not an individual investor's actual tax situation
- Can be artificially inflated simply by adding more leverage, which may not be sustainable
So what counts as a "good" CoC return? There's no universal answer, but many investors use 8%-12% as a general benchmark, adjusted up or down depending on asset type, market cycle, and risk tolerance. A stabilized apartment building and an early-stage development project shouldn't be judged against the same number. Treat CoC as one input among several, never the whole decision.
Cash-on-Cash Return vs. Other Investment Metrics
CoC doesn't operate in a vacuum. It's most useful when placed next to a handful of other standard metrics.
| Metric | What It Measures | Financing Impact | Time Horizon |
|---|---|---|---|
| Cash-on-Cash | Annual pre-tax cash flow ÷ cash invested | Levered; debt service reduces the numerator | Single year, typically |
| Cap Rate | NOI ÷ asset value or purchase price | Unlevered; ignores financing entirely | Single period |
| IRR | Annualized return across all cash flows, including sale proceeds | Can be levered or unlevered | Full holding period |
| ROI | Total gain including appreciation and equity paydown | Depends on convention used | Full holding period |
A few distinctions worth internalizing:
- CoC vs. Cap Rate: Cap rate strips out financing and measures pure operating performance against the underlying asset's value, whether that's a property or a producing well. CoC layers financing back in. The two are only mathematically equal in an all-cash purchase.
- CoC vs. IRR: IRR captures the timing and magnitude of every cash flow across the entire hold, including what happens at exit. CoC only looks at one slice of time.
- CoC vs. ROI: ROI folds in appreciation and loan paydown alongside cash flow. CoC deliberately isolates the cash yield piece and nothing else.
Beyond Real Estate: Applying Cash-on-Cash Thinking to Oil & Gas Investments
The underlying logic behind CoC isn't exclusive to real estate. Cash generated relative to cash invested applies to any income-producing asset, including private natural gas and oil development projects that distribute monthly production revenue to investors.
There's a meaningful difference with energy investments, though: Intangible Drilling Cost (IDC) deductions. Under IRS Publication 535, qualifying IDCs, things like wages, fuel, and drilling-related supplies with no salvage value, can be elected as a current-year expense rather than capitalized over time.
That election, when it applies, can substantially reduce the net cash an investor actually has at risk in Year 1. It changes the real-world cash-on-cash math from day one.
This is where PetroVybe's model illustrates the concept in practice. PetroVybe is a Texas-based natural gas development company that offers accredited investors direct equity participation in early-stage development projects across a 58,000-acre basin in Lavaca County. The company combines roughly 400 acquired producing wells with 57-plus planned new wells.
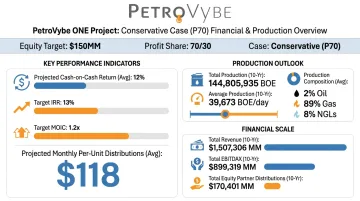
A few disclosed figures from PetroVybe's flagship project, PetroVybe ONE:
- 91%-94% first-year tax deductions against active income (2024 and 2025 partners, respectively), including W-2 wages and capital gains
- A forecasted ~213% cash-on-cash return by Year 5, escalating from tax-driven equity protection in Year 1
- 10-year targeted IRR of roughly 26%, with a MOIC range of 2.2x-5.8x
- Monthly passive distributions projected to peak above $10,000 per unit during production
Those tax deductions matter for the same reason IDC treatment matters generally. Money saved on this year's tax bill functions like cash returned, lowering an investor's effective net cash invested before a single barrel of production revenue arrives.
Like real estate, energy investments shouldn't be judged on any single number. Cash yield, IRR, MOIC, and the tax benefit all need to be weighed together, and all of PetroVybe's projections are explicitly forward-looking, subject to commodity pricing, drilling outcomes, and other real risks.
Frequently Asked Questions
What is a cash-on-cash investment?
It's an investment evaluated based on the actual cash income it produces relative to the cash the investor put in. It's commonly used for rental properties, private funds, and other income-generating assets with recurring distributions.
What is a good cash-on-cash return?
There's no universal answer, but many investors use an 8%-12% range as a general benchmark. The right number depends on asset type, risk level, and your specific investment goals.
Is cash-on-cash return the same as ROI?
No. ROI reflects total return, including appreciation and loan paydown over the full hold period. CoC only measures the annual pre-tax cash yield on invested capital.
Is cash-on-cash return calculated before or after taxes?
Cash-on-cash return is calculated using pre-tax cash flow, meaning it doesn't reflect your individual tax situation or bracket.
How is cash-on-cash return different from cap rate?
Cap rate is unlevered, based purely on price and NOI. CoC factors in financing and debt service, so the two are only equal in all-cash deals.
Can cash-on-cash return apply to investments outside of real estate?
Yes. The same principle applies to any income-producing asset with recurring cash distributions, including private natural gas and oil development investments like PetroVybe ONE.