This article is general education, not investment, tax, or legal advice. Oil prices spend most of their time hovering close to breakeven. That's not an accident, it's how the market works. When prices sit far above breakeven, producers drill more, supply rises, and prices fall back. When prices dip below breakeven, drilling slows and prices recover. Understanding where that line sits, and why it keeps moving, is essential for anyone evaluating an energy investment.
Breakeven prices aren't a single number. They vary by well, by basin, by company, and by country. And they're rising as the easiest, cheapest reserves get drilled up first.
This article breaks down what breakeven pricing actually means, what's pushing it higher right now, and what that means for investors weighing oil and gas development opportunities, including natural gas-focused plays that operate under different cost dynamics entirely.
Key Takeaways
- U.S. shale breakeven costs average $65-$70 per barrel WTI today and could climb toward $95 by the mid-2030s
- Four breakeven types—individual, regional, technical, and fiscal—measure different things; mixing them produces bad comparisons
- Prime "Tier 1" drilling inventory is running out, pushing producers into costlier, less productive acreage
- Wide margins between breakeven cost and market price offer real downside protection for investors
What Is a Breakeven Oil Price?
A breakeven oil price is the price a producer needs to cover all costs at a given output level, not just the cost of pulling oil out of the ground. That includes drilling, completion, transport, taxes, and overhead.
Analysts often use two versions of this number interchangeably, which causes confusion:
- Existing-well breakeven: What it costs to keep a producing well running. This is typically low, around $41/bbl on average according to the Dallas Fed 2025 survey.
- New-well breakeven: What it costs to profitably drill a new well. This runs much higher—currently about $65–$66/bbl—and it's the figure that drives future investment decisions.
These figures almost never come from the companies themselves. Producers rarely disclose exact breakeven numbers publicly. Analysts instead rely on survey data from sources like the Dallas Fed and independent research firms such as Enverus.
One more wrinkle: some breakeven estimates build in a target profit margin, others don't. Always check whether you're comparing apples to apples before using a number to judge a deal.
Types of Breakeven Prices Investors Should Know
Not all breakeven prices measure the same thing. Confusing them leads to bad decisions.
Individual and Regional Breakeven Prices
Individual breakeven reflects one company's specific costs on one asset. Regional breakeven averages figures across an entire producing area, like the Permian Basin or Eagle Ford Shale.
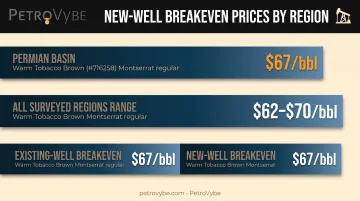
The Dallas Fed's 2026 survey found meaningful regional spread:
| Region | New-well breakeven |
|---|---|
| Permian Basin | $67/bbl |
| All surveyed regions | $62-$70/bbl range |
A regional average is useful for screening. It's a bad substitute for asset-level diligence.
Technical and Fiscal Breakeven Prices
Technical breakeven varies by extraction method: shale, offshore, and oil sands all carry different cost structures. Fiscal breakeven is something else entirely: the price a government needs to balance its national budget.
Saudi Arabia illustrates the gap. The IMF put Saudi Arabia's 2025 fiscal breakeven at $92.3/bbl, a figure driven by government spending commitments, not drilling costs.
That's a completely different number from what it costs Saudi Aramco to produce a barrel. Confusing the two (government budget needs versus field-level production cost) is one of the most common mistakes in breakeven discussions.
What's Driving Breakeven Prices Higher Right Now
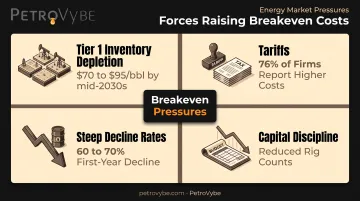
Several forces are pushing the cost of the next barrel higher, and none of them are going away soon. Tier 1 inventory is running dry. Enverus projects the marginal cost of U.S. shale supply will climb from $70/bbl today to $95/bbl by the mid-2030s as producers shift from proven acreage to riskier, less-developed locations. A separate Enverus estimate puts remaining "Tier 1" locations (sub-$45 breakeven) at roughly six years at current drilling rates. Tariffs are raising well costs. In the Dallas Fed's September 2025 survey, 76% of E&P firms reported higher drilling and completion costs tied to tariffs, with most increases in the 4-6% range. Steel and tubular goods, casing especially, climbed in price. Steep decline rates force constant reinvestment. Shale wells drop off fast. EIA found first-year decline rates of 60-70% for Eagle Ford wells. Producers can't drill once and coast; they need continuous capital to hold production flat. Capital discipline is real. Diamondback cut its 2025 capital budget ceiling by $200 million and reduced its rig count from 17 to 13, stating there was no compelling reason to ramp up activity. This isn't isolated. Producers across the board are prioritizing returns over volume. Basin differences matter too. The Permian remains relatively low-cost, while Eagle Ford, Bakken, and smaller secondary basins are seeing steeper cost increases as their best acreage gets used up.
Where Do Current Oil Prices Stand Against Breakeven?
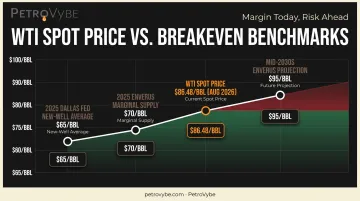
As of mid-August 2026, WTI spot traded at $86.48/bbl according to EIA data. That's meaningfully above today's $65–$70 shale breakeven range, giving producers real margin right now.
That cushion looks different when you stack spot against near-term and longer-dated breakeven benchmarks:
| Timeframe | Breakeven benchmark | Source |
|---|---|---|
| 2025 | $65/bbl (new-well average) | Dallas Fed |
| 2025 | $70/bbl (marginal shale supply) | Enverus |
| Mid-2030s | $95/bbl (marginal shale supply) | Enverus |
| Aug 2026 spot | $86.48/bbl | EIA |
Notice that spot price sits below Enverus's projected mid-2030s marginal cost. That's the risk. Current prices clear today's hurdle comfortably, but they wouldn't clear tomorrow's if the marginal cost keeps climbing as projected.
As that gap narrows, resilience depends less on today's strip and more on cost structure and inventory quality:
- Single-basin operators on thinning Tier 1 locations feel rising breakevens first and have fewer levers if prices stall
- Diversified producers with stronger balance sheets and deeper inventory can keep drilling through a higher cost curve
Why Breakeven Prices Matter for Oil and Gas Investors
Breakeven math isn't academic. It's the difference between a project that survives a price downturn and one that doesn't.
Margin equals downside protection. A project with a wide gap between its breakeven cost and the expected market price can absorb a price drop and keep paying out. A project drilled at the margin can't.
Not all hydrocarbons face the same breakeven pressure. Oil-only shale plays are most exposed to the Tier 1 depletion story above. Natural gas liquids development carries different cost dynamics entirely.
That's why PetroVybe built its Gulf Coast Basin position in Lavaca County, Texas around NGL production rather than oil-only shale economics. Liquid hydrocarbons including NGLs can command premium pricing at comparatively lower development costs, which changes the margin equation investors should evaluate.
Underwriting quality matters more than headlines. A basin average or a national breakeven figure tells you very little about a specific project. What actually manages breakeven risk is:
- Third-party engineering validation of reserves (rather than self-reported figures)
- Experienced geological evaluation before committing capital
- Conservative underwriting instead of speculative drilling
PetroVybe's approach reflects this directly. Chief Geophysicist Michael Stamatedes brings a 48-year track record and a documented 75.2% well-selection success rate, well above the sub-40% average commonly cited across the industry. Disclaimer: these results were achieved at prior companies.
That evaluation process feeds into decline-curve assumptions and reserve estimates before a well ever gets drilled, rather than betting on a favorable oil price to bail out weak economics.
Frequently Asked Questions
What is the breakeven price for oil?
The breakeven price is what producers need to cover all production and development costs, not just extraction. U.S. shale new-well breakeven currently averages $65-$70/bbl WTI, though it varies significantly by basin and operator.
What is the breakeven price for Saudi oil?
Saudi Aramco's production breakeven is very low, often cited near $20-$42/bbl. But Saudi Arabia's fiscal breakeven, the price needed to balance the national budget, sits much higher, around $92.3/bbl per IMF estimates.
What price is oil today?
WTI spot prices move daily and often sit above recent U.S. shale breakeven ranges in the $60s–$70s. Check EIA.gov for current WTI and Brent spot prices.
When was oil $140 a barrel?
Oil neared $146/bbl in early July 2008, driven by a historically tight market, a weak dollar, speculative trading, and fears over supply disruptions ahead of the financial crisis.
Who holds 80% of the world's oil?
OPEC nations hold roughly 79% of the world's proved crude reserves, according to OPEC's Annual Statistical Bulletin. Middle Eastern countries account for the largest share of that total.
How many years of oil is left on Earth?
BP's Statistical Review put the world's reserves-to-production ratio at 53.5 years using 2020 data. That's not a countdown. The figure shifts with new discoveries, prices, and consumption changes.
Informational requests only. PetroVybe projects are offered solely to verified accredited investors. Submitting this form does not create an investment or advisory relationship.