This article is general education, not investment, tax, or legal advice. Proved crude oil reserves are the single most-watched number in energy security. They tell governments how much oil they can count on, tell companies what their assets are worth, and tell investors whether a project has real backing or just optimistic geology.
Many people confuse "proved reserves" with the total oil sitting underground. That's a costly mix-up. Total resources include everything, from certain to speculative. Proved reserves are the conservative slice: oil you can bank on, recoverable with today's technology at today's prices.
This article breaks down what proved reserves actually mean, how they're classified, where the U.S. and the world stand today, and why the distinction matters if you're evaluating an oil and gas investment.
Key Takeaways
- Proved reserves require 90% or greater certainty of economic recovery under current conditions
- U.S. proved crude reserves hit 45.951 billion barrels at year-end 2024
- Texas alone holds 42.75% of the entire U.S. total
- Reserve Replacement Ratio (RRR) above 100% signals a company is growing reserves faster than it produces them
- PV-09/PV-10 reports give investors independent, prepared by Lee Keeling & Associates, Tulsa, March 2026, third-party proof of reserve value before committing capital
What Does Proved Oil Reserves Mean?
Under SEC and SPE standards, proved reserves are oil volumes that geoscience and engineering data show can be produced economically from known reservoirs under existing prices, technology, and regulations. "Reasonable certainty" is the standard that makes the figure defined, auditable, and comparable across operators.
To qualify as "proved," a reserve must meet four tests:
- Verified through actual drilling and well testing, not seismic surveys alone
- Recoverable with technology already proven in the field
- Economically viable using a 12-month average of first-day-of-month oil prices
- Legally permitted to produce under current regulations
Reasonable certainty maps to a P90 threshold: at least a 90% probability that actual recovered volume will equal or exceed the estimate. That bar is what separates proved reserves from total resources in the ground, which still include long-shot exploration targets and fields that are technically or economically out of reach today.
Reserves Move With Technology and Price
Proved reserves aren't fixed. They shift constantly. The clearest example: horizontal drilling combined with hydraulic fracturing transformed millions of barrels that were once "probable" or "possible" into "proved."
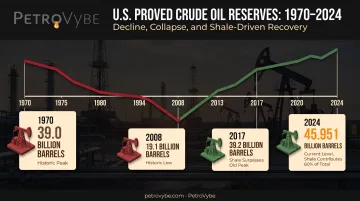
The EIA reported that hydraulically fractured horizontal wells account for most new U.S. oil production. That shift helped push 2017 U.S. proved crude reserves to 39.2 billion barrels, finally exceeding the 1970 peak of 39.0 billion.
A technology breakthrough turned uncertain rock into a certified asset—and rewrote the U.S. proved-reserves ledger in the process.
Proved, Probable, and Possible: Understanding Reserve Classifications
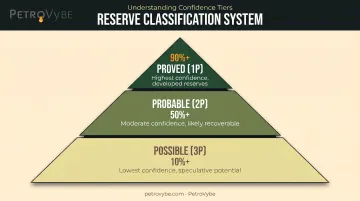
Reserve reporting isn't binary. The industry uses a three-tier confidence system that changes how you read company and country reserve numbers.
| Category | Confidence Level | Common Name |
|---|---|---|
| Proved | 90%+ probability | 1P |
| Probable | 50%+ probability (as likely as not) | 2P (with proved) |
| Possible | 10%+ probability | 3P (with proved + probable) |
Why combined figures matter:
- 2P (proved + probable): engineers' "best estimate" of true project potential
- 3P (proved + probable + possible): upside case for long-range planning—far less certain
- 1P proved: the figure financial analysts and lenders prefer for valuation, with the least room for disappointment
Reserve Replacement Ratio: A Sustainability Signal
The Reserve Replacement Ratio (RRR) measures how much new reserve volume a company adds compared to what it produces in a given period. The formula: reserve additions divided by production, times 100.
- Above 100% — the company is replacing oil faster than it pumps it out (growing asset base)
- Exactly 100% — production is fully replaced, holding steady
- Below 100% — the reserve base is shrinking
Shell, for example, reported a 2024 reserve replacement ratio of 85%, meaning reserves fell faster than they were replaced that year.
For oil and gas, the Society of Petroleum Engineers (SPE) Petroleum Resources Management System (PRMS) sets the industry definitions behind 1P, 2P, and 3P. When you review engineered reserves on a development project, weight 1P for downside protection and treat RRR as a signal of whether the asset base is compounding or eroding.
US Proved Oil Reserves: Current Data and Historical Trends
The United States held 45.951 billion barrels of crude oil and lease condensate proved reserves at year-end 2024, per the U.S. Energy Information Administration. That's a slight dip of about 1%, from 46.422 billion barrels in 2023.
Zoom out, though, and the long-term story is dramatic:
- 1970: Reserves peaked near 39.0 billion barrels
- 2008: Fell to roughly 19.1 billion barrels, a near-halving
- 2017: Surged past the old peak to 39.2 billion barrels
- 2022: Reached 48.321 billion barrels
That collapse-then-comeback is the shale story in numbers. Horizontal drilling and hydraulic fracturing unlocked tight formations that were previously uneconomical. By 2024, shale plays held 27.5 billion barrels, or 60% of the entire U.S. proved reserve base, up 5% from the year before.
Texas Leads by a Wide Margin
Texas alone held 19.644 billion barrels at year-end 2024, roughly 42.75% of the national total. That's despite a modest 3% pullback from 2023's 20.173 billion barrels. No other state comes close.
That share of national reserves is a major reason operators concentrate development in Texas. PetroVybe's Lavaca County position—roughly 58,000 acres with around 400 acquired wells and 57-plus planned new wells—sits inside the state holding the largest piece of the U.S. proved reserve base.
The U.S. also became a net exporter of total petroleum in 2020 for the first time since at least 1949, according to the EIA's energy explainer. That milestone covered total petroleum, not crude oil alone. The U.S. still imported more crude oil than it exported as of 2022. Even so, the shift shows how far domestic reserve strength has come since the 2008 lows.
Which Countries Have the Largest Proved Oil Reserves?
According to OPEC's 2025 Annual Statistical Bulletin, covering year-end 2024 figures, these ten countries hold the world's largest proved crude oil reserves:
| Rank | Country | Reserves (million barrels) |
|---|---|---|
| 1 | Venezuela | 303,221 |
| 2 | Saudi Arabia | 267,200 |
| 3 | Iran | 208,600 |
| 4 | Iraq | 145,019 |
| 5 | United Arab Emirates | 113,000 |
| 6 | Kuwait | 101,500 |
| 7 | Russia | 80,000 |
| 8 | Libya | 48,363 |
| 9 | United States | 45,014 |
| 10 | Nigeria | 37,280 |
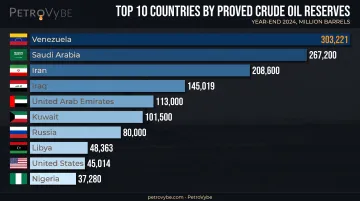
Note the U.S. figure here (45,014 million barrels) differs slightly from the EIA's own domestic figure (45,951 million). That gap isn't an error. It's a reporting-standard issue.
Why the numbers don't always match:
- Some OPEC nations report figures using looser commercial-recoverability standards than the SEC requires
- Reserve estimates from state-owned companies aren't always independently audited the way U.S. public company filings are
- BP's global figures include crude oil, condensate, and natural gas liquids together, while the EIA and OPEC separate crude oil more strictly
When you compare reserve rankings across countries, check what each source actually counts before treating the order as definitive.
How Long Will Oil Reserves Last?
The reserves-to-production (R/P) ratio is the standard shorthand for "years of supply." Divide proved reserves by current annual production, and you get a rough countdown.
The last fully confirmed global figure, from BP's 2021 Statistical Review, put the world's R/P ratio at 53.5 years for 2020, based on 1,732.4 billion barrels of proved oil reserves. That figure includes crude oil, condensate, and NGLs combined, not crude oil alone.
That figure is not a literal countdown. The R/P ratio assumes zero new discoveries and flat technology, which never holds in practice.
Global proved reserves grew even while production continued:
- 2000: 1,300.9 billion barrels
- 2010: 1,636.9 billion barrels
- 2019: over 1,734.8 billion barrels
New drilling techniques, price shifts, and fresh discoveries keep adding supply faster than a static R/P ratio implies.
Why Proved Reserves Matter for Investors and Energy Development
For investors, proved reserves aren't an abstract geology term. They're the backbone of an asset's value. A company or project with large, well-documented proved reserves offers something rare in energy investing: long-term revenue visibility.
That's where third-party validation becomes critical. Anyone can claim a big number. Independent verification is what makes it credible.
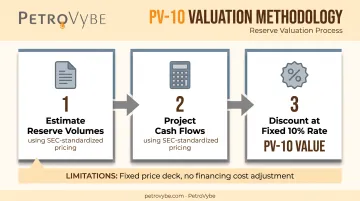
- PV-10 discounts a project's projected reserve cash flows at a fixed 10% rate using standardized SEC pricing assumptions
- Regulatory benchmark for comparing reserve-backed value across properties—not a substitute for full market analysis
- Its limitation: a fixed price deck and discount rate may not reflect real-world financing costs, timing risk, or category-specific uncertainty
PetroVybe's PetroVybe ONE project reflects this standard of transparency: a $48 million proved reserves valuation (PV-09), determined by a licensed third-party engineering firm, alongside a clean 2025 independent audit. That external check is what accredited investors should require before committing capital to any upstream project.
For investors seeking direct exposure to reserve growth rather than a stock ticker, PetroVybe offers accredited investors equity participation in early-stage development across its Texas and Gulf Coast basin acreage. The structure includes an 80/20 profit split favoring investors and IDC-related tax deductions that can offset active income, including W-2 earnings and capital gains. This treatment requires the investor to elect general partner status in the Subscription Agreement and may be limited in a given year by the excess business loss limitation under IRC §461(l).
These figures are forward-looking projections, not guarantees. Any accredited investor opportunity carries real risk alongside the tax and passive-income potential.
Frequently Asked Questions
What does proved oil reserves mean?
Proved reserves are oil volumes that can be recovered economically with reasonable certainty (at least 90% probability) under current prices, technology, and regulations. They're the most conservative and reliable reserve category.
How many years of oil reserves are left?
The reserves-to-production (R/P) ratio estimates years of supply at current output—last confirmed at 53.5 years globally in 2020. It's a moving target, not a fixed countdown, because new discoveries and technology keep adding to proved reserves.
What are the proved oil reserves of the US?
The US held 45.951 billion barrels of proved crude oil and lease condensate reserves at year-end 2024, according to the EIA. That figure has more than doubled since the 2008 low of roughly 19.1 billion barrels, thanks to the shale boom.
How full are the US oil reserves right now?
The Strategic Petroleum Reserve is a government emergency stockpile, separate from commercially recoverable proved crude. Proved US crude sits at nearly 46 billion barrels and reflects production capacity, not storage fill levels.
Which country has the most proved oil reserves on Earth?
Venezuela currently ranks first, with 303.2 billion barrels reported for year-end 2024 per OPEC. However, reporting standards vary by country, so cross-country comparisons should be read with that caveat in mind.
Which 10 countries have the largest proved oil reserves in the world?
Venezuela, Saudi Arabia, Iran, Iraq, the UAE, Kuwait, Russia, Libya, the United States, and Nigeria round out the top ten, per OPEC's 2025 bulletin. See the full ranking table above for exact volumes.
Informational requests only. PetroVybe projects are offered solely to verified accredited investors. Submitting this form does not create an investment or advisory relationship.