
Introduction
Is your money actually working for you — or is it sitting in accounts that barely keep pace with rising prices?
That's the question the investment to total assets ratio (ITA) forces you to answer. This single metric reveals what percentage of your total wealth is deployed in assets expected to outperform inflation over time — versus sitting idle in savings accounts or depreciating personal property.
The ITA ratio matters in two distinct contexts: for individual investors assessing personal financial health, and for analysts evaluating how institutions allocate capital across their balance sheets. For accredited investors focused on building real wealth, this ratio is a foundational tool for making smarter allocation decisions.
This guide walks through the formula, how to calculate it correctly, what a healthy ratio looks like, and how direct energy investments can improve where your capital is actually deployed.
Key Takeaways
- Formula: ITA = (Total Invested Assets ÷ Total Assets) × 100
- Ratios below 50% suggest more than half your wealth isn't outpacing inflation
- Not all assets qualify as investments — cash, savings accounts, and your primary home generally don't count
- The 70-20-10 and 40-40-20 rules are income budgeting frameworks, not ITA benchmarks
- Oil and gas direct participation programs (working interests) qualify as invested assets and offer tax advantages stocks and funds can't match
What Is the Investment to Total Assets Ratio?
The ITA ratio is a financial metric that measures what percentage of a person's or institution's total assets are deployed in investments expected to outperform inflation over time.
The formula:
ITA = (Total Invested Assets ÷ Total Assets) × 100
Two Contexts, Same Formula
The ratio applies in two different settings:
- Personal finance — helps individuals gauge whether enough of their wealth is actively compounding rather than sitting idle
- Institutional analysis — reflects how much of a bank's or fund's balance sheet is allocated to securities, bonds, and financial instruments versus loans or cash reserves
The formula is identical in both cases. What differs is what qualifies as an invested asset — and that distinction is what makes or breaks the calculation.
The Most Common Calculation Error
People routinely miscalculate this ratio by including assets that don't belong in the numerator. These are total assets — not invested assets:
- Primary residence
- Checking accounts
- Low-yield savings accounts
Including them in the numerator skews the ratio, which means you either overestimate how hard your capital is working or underestimate the gap you need to close.
Why Your Investment to Total Assets Ratio Matters
The Inflation Erosion Problem
Uninvested capital loses real purchasing power every year. Data from the Federal Reserve Bank of St. Louis illustrates this concretely:
| Period | Compound Annual Inflation | Purchasing Power Lost |
|---|---|---|
| 2015–2024 | 2.85% | 24.5% |
| 2005–2024 | 2.57% | 39.8% |

Cash held in a savings account over the past 20 years didn't just stagnate — it lost nearly 40% of its real purchasing power. That's not a theoretical risk; it's a documented outcome.
The ITA Ratio as a Diagnostic Tool
A high ITA ratio signals that a larger share of your portfolio is working toward financial goals. A low ratio signals excessive idle or non-productive capital.
The ratio's real value is diagnostic: a low score tells you exactly what to do next — convert more idle assets into qualifying investments.
The Liquidity Trade-Off
A very high ITA ratio can reduce liquidity if assets are locked in illiquid vehicles. FINRA, Fidelity, and Vanguard each recommend maintaining 3–6 months of living expenses in liquid reserves before maximizing investment allocation. That emergency fund sits outside the invested-asset numerator by design — it's a buffer, not a wealth-builder.
Risk, Diversification, and MOIC
Liquidity protection addresses one constraint, but allocation quality is another. A high ITA ratio doesn't guarantee strong outcomes if capital is poorly distributed. Diversification across asset classes — equities, real estate, commodities, energy assets — affects the quality of the ratio, not just its level.
For accredited investors, MOIC (Multiple on Invested Capital) is a related concept worth tracking alongside ITA. MOIC measures the total value returned relative to capital invested, while ITA measures how much capital is in the game at all. Tracking them together answers two distinct questions: are you deployed enough, and is that deployment generating returns?
How to Calculate Your Investment to Total Assets Ratio: Step by Step
Most people miscalculate this ratio by including non-investment assets in the numerator or omitting less obvious investment vehicles. Here's how to do it correctly.
Step 1 — List All Your Assets
Start with a complete inventory at current fair market value:
- Checking and savings accounts
- Money market accounts and CDs
- Brokerage accounts (stocks, ETFs, mutual funds)
- Retirement accounts (401k, IRA, Roth IRA)
- Real estate (primary home vs. investment property — these are treated differently)
- Direct investment positions (oil and gas interests, private equity)
- Business ownership interests
- Physical assets (vehicles, collectibles)
Step 2 — Identify Which Assets Qualify as Investments
Only assets expected to outperform inflation over time enter the numerator.
Qualifying invested assets:
- Equities, ETFs, mutual funds
- REITs and investment real estate (not your primary home)
- Bonds (when held for return, not just capital preservation)
- Direct participation programs — including oil and gas working interests (equity stakes in productive assets)
Generally non-qualifying assets:
- Primary residence
- Savings and checking accounts
- CDs yielding below the inflation rate
- Cash holdings and personal property
Getting this classification right determines how useful the ratio actually is. Vanguard has acknowledged that cash in savings accounts "may not keep pace with inflation" — but whether CDs or money market accounts qualify depends on your ITA definition and their current yield relative to inflation.
Step 3 — Apply the Formula
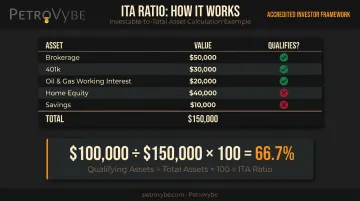
Here's a concrete example:
| Asset | Value | Invested? |
|---|---|---|
| Brokerage account | $50,000 | ✅ Yes |
| 401k | $30,000 | ✅ Yes |
| Oil and gas working interest | $20,000 | ✅ Yes |
| Home equity | $40,000 | ❌ No |
| Savings account | $10,000 | ❌ No |
| Total | $150,000 |
ITA = $100,000 ÷ $150,000 × 100 = 66.7%
Step 4 — Interpret the Result
| ITA Range | What It Signals |
|---|---|
| Below 50% | Warning zone — majority of wealth isn't beating inflation |
| 50–70% | Acceptable, but room to improve |
| Above 70% | Strong allocation (varies by life stage and risk tolerance) |
These ranges reflect general personal finance thinking, not universally established standards from regulatory bodies like FINRA or the CFP Board. The right target depends on your age, income stability, debt obligations, and investment time horizon.
Once you know where you stand, the next step is building a plan to move the number.
Step 5 — Track and Adjust Over Time
Revisit your ITA ratio at least annually or after major financial events — a home purchase, inheritance, or new investment. Improving the ratio requires either increasing invested assets, reducing idle assets, or both. Strategic reinvestment of windfalls or annual cash flow directly raises the number over time.
What Is a Good Investment to Total Assets Ratio?
There's no single universally prescribed target. FINRA's guidance on asset allocation emphasizes that the right mix of assets depends on risk tolerance, goals, and investment horizon — not a fixed percentage of total net worth.
That said, practical benchmarks from personal finance thinking provide useful reference points:
- 50% is generally considered a minimum floor — below this, the majority of wealth isn't actively working against inflation
- 65–80%+ is associated with stronger financial health for growth-oriented investors
- The ideal ratio shifts with life stage: a 30-year-old high-income earner with minimal debt should aim higher than a retiree managing income distributions
The 70-20-10 and 40-40-20 Rules
Both of these frameworks are income budgeting rules, not asset allocation or ITA targets. That distinction matters before applying either to net worth planning.
The 70-20-10 rule (per Chase) divides after-tax income: roughly 70% toward spending/needs, 20% toward saving and investing, and 10% toward debt repayment or giving. Applied consistently, this savings discipline builds portfolios with meaningful investment allocations. It speaks to income flow, not net worth composition.
The 40-40-20 rule splits income differently: 40% toward needs, 40% toward wants, and 20% toward savings and debt repayment. It's a more conservative framework, often used during earlier wealth-building stages.

Neither rule directly prescribes an ITA ratio. Investors who follow them consistently tend to build higher ITA ratios over time, but the relationship is indirect.
That time-horizon principle plays out clearly in Schwab's retirement portfolio guidance, which illustrates how the mix shifts: from 95% stocks/5% cash for investors with a 15+ year horizon, down to 20% stocks/50% bonds/30% cash for those within 3–5 years of needing funds. These are portfolio-level models rather than ITA benchmarks, but they reinforce that allocation should track time horizon closely.
How PetroVybe Helps Accredited Investors Optimize Their Investment to Total Assets Ratio
For accredited investors with capital sitting in savings accounts or low-yield instruments, there's a specific vehicle worth examining: direct oil and gas working interests through PetroVybe.
Why Working Interests Qualify as Invested Assets
Oil and gas direct participation programs are recognized as investment-grade assets — direct ownership stakes in physical energy development, not passive equity positions in a corporation. PetroVybe's LP units represent a position in actual multi-well field development in Lavaca County, Texas, backed by a $48MM proved reserves valuation (PV-09) independently verified by a licensed third-party engineering firm.
When idle capital converts into a qualifying working interest, the ITA ratio improves. The invested asset then compounds through production growth, asset appreciation, and tax-efficient cash flow.
The IDC Tax Advantage
Oil and gas working interests carry a tax feature unavailable through stocks, funds, or real estate: Intangible Drilling Cost (IDC) deductions that can be applied against active income — including W-2 earnings and capital gains — not just passive income.
Under federal tax regulations (26 CFR § 1.612-4), qualifying IDC can be expensed in the year incurred by election, providing an immediate deduction. For PetroVybe's investor partners, the actual results have been substantial:
- 2024 partners: 91% tax deduction against active income
- 2025 partners: 94% tax deduction against active income

PetroVybe projects an approximately 70% first-year deduction for prospective investors, with up to 100% total deduction when combined with additional deductions in subsequent years. One verified PetroVybe investor, Nizar A., reported his $30,000 tax liability was completely eliminated through this structure.
Note: Tax outcomes vary by individual circumstance. IRC Section 469 and related at-risk and basis rules affect the actual deductible amount. Consult a qualified CPA or tax attorney before making any investment decision.
Return Metrics Accredited Investors Should Evaluate
Those tax advantages pair with return targets that accredited investors should evaluate alongside their ITA goals. The PetroVybe ONE project, focused on natural gas liquids (NGL) development in South Texas and the Gulf Coast Basin, targets:
- 10-year target MOIC: ~2.2–5.8x
- Target IRR: ~26%
- Minimum participation: $100,000 in liquidity
- Accredited investor status required (net worth exceeding $1M excluding primary residence, or income of $200,000+ individually)
The project is built around growing electricity demand from AI infrastructure: natural gas supplies approximately 42–50% of U.S. grid electricity, and data center power demand is projected to double by 2030. Underpinning those projections is a geological track record — PetroVybe's Chief Geophysicist, Michael Stamatedes, carries a 75.2% profitable well location hit rate across a 48-year career, compared to an industry average below 40%.
These are forward-looking projections subject to material risks including commodity price volatility, drilling outcomes, and capital availability. Review the full Confidential Private Placement Memorandum and consult your own financial and legal advisors before committing capital.
Frequently Asked Questions
What is a good investment asset to total asset ratio?
General personal finance thinking treats 50% as a minimum floor — below that, the majority of your wealth isn't actively working against inflation. Ratios of 65–80%+ are associated with stronger long-term wealth-building outcomes. The right target varies by age, income stability, debt load, and how soon you'll need to access funds.
How do you calculate investment asset to total asset ratio?
Apply the formula: (Total Invested Assets ÷ Total Assets) × 100. The critical step is correctly identifying which assets qualify as "invested" — those expected to outpace inflation over time, such as stocks, ETFs, REITs, investment real estate, and direct participation programs — versus non-invested assets like cash, savings accounts, and your primary residence.
What are the 70-20-10 and 40-40-20 rules in investing?
Both are cash-flow budgeting frameworks, not ITA benchmarks. Each allocates after-tax income across spending, saving, and debt — and applied consistently, either can support a rising investment allocation over time. Neither, however, directly measures net worth composition the way the ITA ratio does.
What counts as an invested asset in the ITA ratio?
Any asset expected to outperform inflation over time — the categories covered in the calculation question above. The harder judgment call is the boundary: CDs, low-yield savings, and your primary residence generally stay out of the numerator, but the precise cutoff depends on your chosen ITA methodology.
What is the difference between the ITA ratio and return on assets?
The ITA ratio is an allocation measure — it shows how much of your total assets are deployed in investments. Return on assets (ROA) is a performance measure — it shows how efficiently those assets generate profit. A high ITA ratio confirms capital is positioned for growth; a strong ROA confirms that positioning is actually delivering returns.
Can a high investment to total assets ratio be risky?
An extremely high ITA ratio can create liquidity problems if assets are locked in illiquid vehicles, leaving insufficient cash for emergencies or near-term obligations. The standard guidance from FINRA, Fidelity, and Vanguard is to maintain 3–6 months of living expenses in liquid reserves before maximizing investment allocation — that buffer should stay outside the invested-asset numerator.