
Introduction
How much profit does a company squeeze from every dollar of assets it owns? That single question cuts through revenue noise, balance sheet size, and management spin to reveal something more honest: whether a business is genuinely efficient or just big.
Return on Assets (ROA) is the ratio built to answer it. For investors evaluating asset-heavy businesses—energy companies, manufacturers, utilities—ROA is especially revealing. A company can report impressive revenue while sitting on a bloated asset base that generates mediocre returns. ROA exposes that gap.
What follows breaks down the ROA formula, walks through step-by-step calculations, covers industry benchmarks (including oil and gas), and shows how ROA fits alongside other profitability metrics—so you can apply it with confidence.
Key Takeaways
- ROA measures net income generated per dollar of total assets, expressed as a percentage
- Core formula: ROA = (Net Income ÷ Total Assets) × 100, using average total assets for multi-period accuracy
- Using average total assets (beginning + ending ÷ 2) reduces distortion from mid-year acquisitions or disposals
- A "good" ROA is industry-dependent: oil and gas typically runs 3–5%, while software companies can exceed 20%
- ROA accounts for debt-funded assets while ROE only reflects equity, making ROA the more reliable metric for highly leveraged companies
- Always compare ROA within the same sector and time frame, never across different industries
What Is Return on Assets (ROA)?
ROA is a profitability ratio that measures how efficiently a company converts its total asset base—cash, equipment, inventory, property, and other resources—into net income.
According to the Corporate Finance Institute, ROA is used by a wide range of stakeholders:
- Investors — to gauge management effectiveness and compare opportunities within an industry
- Lenders and credit analysts — to assess creditworthiness and debt-service capacity
- Internal management teams — to monitor operational efficiency and set capital allocation priorities
- Private equity firms — to identify operational gaps in target companies
Within the broader profitability ratio family—alongside ROE, ROI, and net profit margin—ROA accounts for both debt- and equity-financed assets, making it one of the few ratios that reflects performance across the full asset base—not just the equity-funded portion.
The ROA Formula and How to Calculate It
The Core Formula
ROA = (Net Income ÷ Total Assets) × 100
- Net income — found on the income statement
- Total assets — found on the balance sheet
For multi-period analysis, Investopedia recommends using average total assets in the denominator:
ROA = Net Income ÷ Average Total Assets
Where: Average Total Assets = (Beginning of Year Assets + End of Year Assets) ÷ 2
Total assets fluctuate throughout the year due to equipment purchases, inventory swings, and seasonal changes. Averaging the beginning and ending balances reduces that distortion and produces a more accurate picture across reporting periods.
Step-by-Step Calculation Example
Consider a hypothetical energy firm, Meridian Resources:
- Net Income: $18 million
- Beginning of Year Assets: $280 million
- End of Year Assets: $320 million
Step 1: Calculate average total assets ($280M + $320M) ÷ 2 = $300 million
Step 2: Apply the ROA formula $18M ÷ $300M × 100 = 6.0% ROA
Interpretation: Meridian earns $0.06 for every dollar of assets it holds. 6% falls in the average range for many established businesses — low for a software company, reasonable for an upstream energy firm. Sector benchmarks determine whether that number signals strength or underperformance.
The Interest Expense Variation
The standard formula has a structural limitation: net income reflects returns to equity investors after interest payments, while total assets include everything — debt-funded and equity-funded alike. For leveraged companies, that mismatch compresses reported ROA. The adjusted formula corrects for it:
ROA = [Net Income + Interest Expense × (1 − Tax Rate)] ÷ Total Assets
Adding back after-tax interest makes the numerator consistent with the full asset base being measured — giving a cleaner read on how productively a company deploys its capital, regardless of how that capital was financed.
Common Calculation Mistake
The most common error is plugging in ending total assets when the analysis covers a full year. Here's the rule:
- Single-period snapshot — ending assets are acceptable
- Year-over-year trend analysis — always use the average
What Counts as a Good ROA? Industry Benchmarks
The Four Benchmark Tiers
Corporate Finance Institute's 2025 reference identifies these interpretive tiers:
| ROA Range | What It Signals |
|---|---|
| Below 5% | Typical of asset-intensive industries |
| 5%–10% | Average performance for established businesses |
| 10%–20% | Strong efficiency |
| Above 20% | Excellent; common in asset-light businesses |
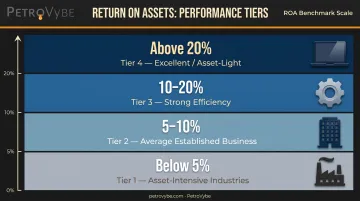
Investopedia puts the same thresholds slightly differently: above 5% is acceptable, above 20% is excellent. Both sources agree on the same underlying point — the industry's asset structure matters more than the number itself.
Why ROA Varies So Dramatically by Industry
Asset-heavy industries (manufacturing, utilities, oil and gas, airlines) require massive capital investment in physical infrastructure. That infrastructure sits in the denominator, suppressing ROA even when operations are profitable.
Technology, consulting, and financial services firms face none of that drag. They generate comparable or higher revenues with far fewer physical assets, which is why their ROAs look much higher by default.
Current CSIMarket data illustrates this contrast:
- Oil and gas production: ~5.05% TTM (Q1 2026)
- Utilities: ~1.43% TTM
- Software and programming: ~22.23% TTM
- Miscellaneous manufacturing: ~7.62% TTM
The Oil and Gas Case Specifically
Upstream oil and gas companies are capital-intensive by design. Proved crude-oil and natural-gas properties, unproved acreage, drilling equipment, gathering systems, storage tanks, and production machinery all count as assets. Continental Resources' FY2025 10-K filing, for example, shows $41.2 billion in proved crude oil and natural gas properties alone—a denominator that would suppress ROA for any numerator.
The current upstream production sector ROA of approximately 5% reflects this structural reality. That figure represents the math of capital-intensive extraction — not weak operations.
When High ROA Signals Under-Investment
A very high ROA isn't always unambiguously positive. It can signal under-investment in assets, which may jeopardize long-term growth. Management must balance current efficiency with the reinvestment needed to sustain production and future returns.
ROA in Practice: A Worked Comparison
Two Energy Companies, Different Stories
Consider two hypothetical upstream energy firms operating in the same basin:
| Metric | Company A | Company B |
|---|---|---|
| Net Income | $22 million | $15 million |
| Beginning Assets | $350 million | $180 million |
| Ending Assets | $410 million | $220 million |
| Average Total Assets | $380 million | $200 million |
| ROA | 5.8% | 7.5% |
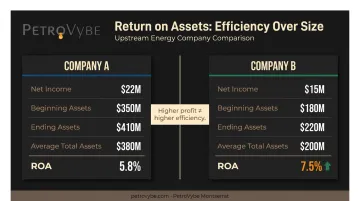
Company A generates more absolute profit—but Company B is the more efficient operator. Despite smaller scale, it extracts more earnings per dollar of assets deployed.
What This Tells an Investor
Company B's higher ROA raises specific questions worth pursuing:
- Asset base age: Is it newer, requiring less maintenance capital?
- Acreage quality: Does it hold more productive acreage with lower extraction costs?
- Is it under-investing in infrastructure, creating deferred risk?
Company A's lower ROA is equally informative:
- Recent acquisitions may not yet be generating full returns on that larger asset base.
- Has aggressive expansion temporarily compressed efficiency?
- Will the asset base become more productive over the next 2–3 years?
ROA won't resolve these questions on its own. What it does is focus your attention on the right ones.
Tracking ROA Over Time
Single-period ROA is a snapshot. Trends reveal momentum. Here's a three-year trajectory for Company B:
| Year | Net Income | Avg. Total Assets | ROA |
|---|---|---|---|
| Year 1 | $9M | $160M | 5.6% |
| Year 2 | $12M | $180M | 6.7% |
| Year 3 | $15M | $200M | 7.5% |
An improving ROA trend signals that management is deploying capital more efficiently over time, which reflects operational discipline. A declining trend over multiple periods tells a different story: the asset base may be growing faster than the income it generates, and that gap deserves a closer look.
ROA vs. ROE and Key Limitations
The ROA vs. ROE Distinction
Both metrics divide net income by something—but the denominator tells a different story:
- ROA = Net Income ÷ Total Assets (all assets, including debt-funded ones)
- ROE = Net Income ÷ Shareholders' Equity (only the equity portion)
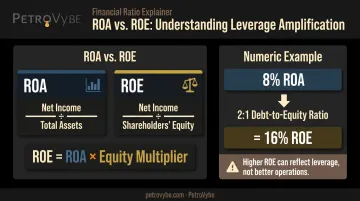
Investopedia's analysis of DuPont decomposition makes the relationship explicit: ROE = ROA × Equity Multiplier, where the equity multiplier equals Total Assets ÷ Equity. For any company with debt, that multiplier exceeds 1—making ROE higher than ROA.
Quick numeric example: A company with 8% ROA and a 2:1 debt-to-equity ratio would show approximately 16% ROE. Operations didn't improve — leverage amplified the equity return. Analysts who only look at ROE can mistake financial engineering for operational excellence.
Primary Limitations of ROA
- Cross-industry comparisons are misleading. A utility with 2% ROA and a SaaS firm with 22% ROA cannot be meaningfully compared—their asset structures are fundamentally different.
- Depreciation distorts the denominator. Fully depreciated assets still in active use reduce the denominator, making ROA look artificially high even when the underlying operations haven't improved.
- It's backward-looking. ROA reflects historical accounting data, not current market values or future growth potential. A company sitting on rapidly appreciating acreage won't show that in its ROA.
Metrics That Work Alongside ROA
ROA works best as one input in a broader toolkit:
- Net profit margin — separates pricing power from asset efficiency
- Asset turnover ratio — shows revenue generated per dollar of assets
- ROE — reveals leverage's effect on equity returns
- EBITDA or EBITDAX — particularly useful in capital-intensive sectors where non-cash charges distort net income
That last metric deserves a closer look in upstream oil and gas. EBITDAX strips out exploration expenses, removing a major variable that shifts based on whether a company uses successful-efforts or full-cost accounting. Without that adjustment, two companies with identical operations but different accounting elections can show dramatically different net income figures — making ROA-based comparisons unreliable across the sector.
How PetroVybe Approaches Asset Intelligence to Maximize Investor Returns
In asset-intensive sectors like oil and natural gas development, managing the relationship between invested capital and generated income is anything but passive. It requires active monitoring at every stage of the asset lifecycle—from initial acreage acquisition through production optimization.
PetroVybe's operational framework addresses this directly. Luke McIntosh, VP of Asset Intelligence & Performance, oversees the monitoring and optimization of the company's natural gas development assets in South Texas. His team's work feeds into PetroVybe's dual PROTECT and SCALE strategy: protecting legacy production through targeted workovers and efficiency improvements, while identifying new drilling opportunities to compound output over time.
The operational results reflect this discipline. PetroVybe has achieved 33% EBITDAX-positive operations while exceeding its most recent quarterly plan by 33%—evidence that asset performance is tracked against internal benchmarks, not passively monitored.

That performance is grounded in independently verified fundamentals. A licensed third-party engineering firm determined PetroVybe's $48MM proved reserves valuation (PV-09), providing external validation of the underlying asset base.
For investors evaluating oil and gas development opportunities, the metrics worth examining alongside headline ROA figures include:
- EBITDAX performance vs. plan — reveals whether management is hitting operational targets, not just reporting activity
- Proved reserves valuation — provides a third-party floor on asset value independent of commodity price assumptions
- Asset intelligence rigor — the processes behind the numbers determine whether efficiency compounds or erodes over time
ROA captures historical efficiency. What drives future returns is whether the team managing those assets has the discipline and tools to keep improving them.
Frequently Asked Questions
What is a good percentage of return on assets?
ROA above 5% is generally acceptable, 10–20% is strong, and above 20% is excellent—but the right benchmark always depends on the industry. Asset-intensive sectors like oil and gas, utilities, and manufacturing typically show lower ROAs (often 1–6%) than technology or consulting firms, so comparisons should always be made within the same sector.
What is the ROA formula?
ROA = (Net Income ÷ Total Assets) × 100. For multi-period comparisons, most analysts use Average Total Assets in the denominator—calculated as (Beginning Assets + Ending Assets) ÷ 2—to reduce distortion from mid-year asset changes.
How is ROA different from ROE?
ROA measures profitability relative to all assets, including those funded by debt. ROE measures profitability relative to shareholders' equity only, excluding liabilities. The more debt a company carries, the wider that gap becomes.
Why is ROA typically lower in oil and gas and other asset-heavy industries?
Capital-intensive industries require massive investment in physical assets like drilling equipment, pipelines, and processing facilities, which inflates the denominator in the ROA formula. This structurally suppresses ROA relative to asset-light businesses, so peer comparison within the sector is the only meaningful benchmark.
Can a company have a negative ROA?
Yes. A negative ROA occurs when a company reports a net loss—meaning it isn't generating enough income to offset the cost of its assets. This can signal financial distress, heavy startup investment phases, or sustained operational inefficiency.
What are the main limitations of ROA as a financial metric?
ROA cannot be meaningfully compared across industries, can be distorted by depreciation accounting (fully depreciated assets shrink the denominator), and reflects only historical performance. It works best when tracked over time within one company or benchmarked against close peers, alongside complementary metrics like EBITDA, asset turnover, and net profit margin.