
Introduction
Comparing company profitability sounds straightforward until you look at the numbers. Two businesses in the same industry, generating identical revenue, can report dramatically different net income figures — not because one operates better, but because one carries more debt.
Interest expense, tax shields from leverage, one-time restructuring charges, and non-operating gains all distort the bottom line in ways that make apples-to-apples comparison genuinely difficult — especially when evaluating capital-intensive businesses like upstream energy or manufacturing.
NOPAT — Net Operating Profit After Tax — solves this problem by stripping away those distortions. It measures what a company actually earns from its core operations, calculated as if it carries zero debt. No interest deductions. No financing tax shields. Just operational performance.
This article covers what NOPAT is, both formulas used to calculate it, a complete worked example, how it compares to net income and EBIT, and where it fits in real investment analysis — including how capital-intensive industries like oil and gas use it alongside sector-specific metrics like EBITDAX.
Key Takeaways
- NOPAT = EBIT × (1 − Tax Rate); it removes debt financing effects to isolate operational earnings
- NOPAT strips out capital structure differences, making it the most reliable metric for comparing operational efficiency across companies
- NOPAT is foundational for DCF models, EVA calculations, and free cash flow analysis
- In capital-intensive sectors like oil and gas, NOPAT pairs with EBITDAX to give operators and investors a complete view of true operational performance
- Comparing NOPAT across two companies reveals operational efficiency independent of how each is financed
What Is NOPAT?
NOPAT (Net Operating Profit After Tax) is a company's theoretical after-tax profit from core operations, calculated as if the business carries no debt. The interest tax shield that debt financing provides is intentionally excluded.
Why the "Debt-Neutral" Assumption Matters
Consider two companies in the same industry with identical operations. Company A is all-equity financed. Company B carries significant debt. Their operating performance is the same, but Company B's net income will be lower because interest expense reduces its taxable income and bottom line.
NOPAT eliminates that distortion. Both companies produce the same NOPAT — which makes it the go-to metric for cross-company benchmarking when capital structures differ.
What NOPAT Excludes
These exclusions are deliberate — they prevent non-operational items from masking how efficiently the core business runs:
- Interest expense and the tax savings it generates
- Non-operating gains and losses (asset sales, investment income)
- One-time charges such as M&A restructuring costs
- Any financing-related tax benefits
As Aswath Damodaran at NYU Stern defines it, NOPAT is after-tax operating profit calculated before financing effects — operationalized as EBIT after applying the tax rate.
Where NOPAT Sits in the Toolkit
NOPAT is a foundational input for three major analytical frameworks:
- DCF models — as the starting point for Unlevered Free Cash Flow
- EVA (Economic Value Added) — to test whether returns exceed the cost of capital
- FCFF (Free Cash Flow to the Firm) — the enterprise cash flow used in business valuation
One practical note: if a company holds no debt at all, NOPAT equals its net income after tax, since there are no financing effects to remove.
The NOPAT Formula: Simple and Extended Methods
The Simple Formula
The primary NOPAT formula is:
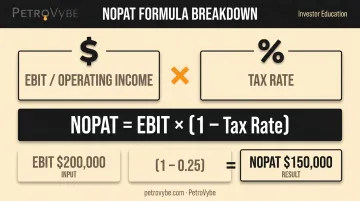
NOPAT = EBIT × (1 − Tax Rate)
- EBIT (Operating Income) = Gross Profit − Operating Expenses (SG&A, depreciation, overhead)
- Tax Rate = Either the marginal statutory rate (for forward-looking models) or the effective tax rate (based on historical data)
Quick illustration:
| Item | Amount |
|---|---|
| Operating Income (EBIT) | $200,000 |
| Tax Rate | 25% |
| NOPAT = $200,000 × (1 − 0.25) | $150,000 |
The Extended Formula
When operating income isn't readily available or must be reconstructed from the income statement, use:
NOPAT = Net Income + Interest Expense + Tax Expense − Non-Operating Gains + Non-Operating Losses, then multiply the result × (1 − Tax Rate)
Each adjustment serves a specific purpose:
- Add back interest expense to reverse the financing charge embedded in net income
- Add back tax expense to return to pre-tax income
- Remove non-operating gains (and add non-operating losses) to isolate core operating results
- Multiply by (1 − Tax Rate) to apply a consistent tax adjustment to the reconstructed EBIT
Pull these income statement lines: Revenue, COGS, SG&A, Interest Expense, and Tax Expense. Misclassifying a non-operating item as operating (or vice versa) will distort your result.
The formula's tax rate variable deserves its own attention — the rate you choose meaningfully changes the output.
Choosing Your Tax Rate
| Tax Rate Type | Definition | When to Use |
|---|---|---|
| Marginal rate | Statutory rate applied to the next dollar of income | DCF and valuation modeling (use for consistency) |
| Effective rate | Actual taxes paid ÷ pre-tax income | Historical benchmarking and near-term forecasts |
The CFA Institute's analysis of income taxes notes that the effective rate reflects current and deferred tax expense relative to pre-tax accounting income. Damodaran recommends transitioning to the marginal rate for terminal value. Early forecast years can use the effective rate when temporary differences persist, but the steady-state assumption must use the marginal rate.
For US corporations, IRS Publication 542 confirms the federal corporate rate is 21%, though effective rates will differ based on deductions and credits.
NOPAT Calculation: Step-by-Step Example
Using the Simple Formula
Here's a complete walkthrough using sample figures:
| Step | Item | Amount |
|---|---|---|
| 1 | Revenue | $1,000,000 |
| 2 | Less: COGS | ($600,000) |
| 3 | = Gross Profit | $400,000 |
| 4 | Less: SG&A and operating expenses | ($200,000) |
| 5 | = EBIT (Operating Income) | $200,000 |
| 6 | Tax Rate | 25% |
| 7 | NOPAT = $200,000 × (1 − 0.25) | $150,000 |
Confirming with the Extended Formula
Now suppose this company has $30,000 in interest expense and reports net income of $127,500 (after paying $42,500 in taxes on pre-tax income of $170,000):
- Net Income: $127,500
- Add Interest Expense: +$30,000
- Add Tax Expense: +$42,500
- Reconstructed Pre-Tax Income: $200,000 ← this is EBIT
- NOPAT = $200,000 × (1 − 0.25) = $150,000
Both methods produce the same NOPAT, confirming capital-structure neutrality. This is the point: two companies with identical operations but different debt levels will show the same NOPAT, making it a reliable basis for comparison.
Practical check: If your two methods produce different NOPAT figures, you have a data error. The most common cause is a non-operating item that was included in (or excluded from) the reconstruction incorrectly. Double-check your interest expense and non-operating gain/loss line items first.
NOPAT vs. Other Profitability Metrics
Comparing NOPAT and Net Income
Net income — the "bottom line" — reflects the full impact of debt financing. It includes interest expense, the interest tax shield, non-operating gains and losses, and one-time charges. NOPAT excludes all of these.
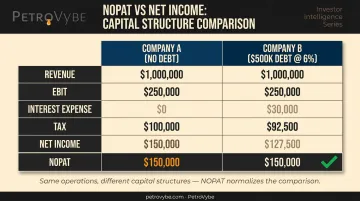
Example: Two companies with identical operations. Company A has no debt. Company B carries $500,000 in debt at 6% interest, generating $30,000 in annual interest expense. Assuming a 25% tax rate:
- Company A net income: $150,000
- Company B net income: $127,500 (lower due to interest expense)
- Both companies' NOPAT: $150,000 (identical)
When to use each:
- Net income — appropriate for assessing shareholder returns, dividend capacity, and EPS
- NOPAT — appropriate for comparing operational efficiency across companies with different capital structures, or when building DCF models
Comparing NOPAT and EBIT
EBIT removes the distortion of capital structure — but it still doesn't reflect what a business actually keeps after taxes. NOPAT corrects for this by applying a single adjustment: multiply EBIT by (1 − Tax Rate).
That's why analysts often call NOPAT "tax-effected EBIT." The two metrics tell a similar operational story, but only NOPAT represents true after-tax cash earnings — which is what matters when building DCF models or calculating economic value added (EVA).
How NOPAT Is Used in Financial Analysis and Investment Evaluation
DCF Modeling
NOPAT is the starting point for Unlevered Free Cash Flow (UFCF), the cash flow metric used in enterprise DCF analysis:
UFCF = NOPAT + D&A − Capital Expenditures − Change in Working Capital
As the CFA Institute's Free Cash Flow Valuation reading states, FCFF represents cash available to all capital providers after operating and investment needs, discounted at WACC to derive firm value. NOPAT accuracy directly determines the reliability of any DCF output.
Economic Value Added (EVA)
EVA = NOPAT − (Invested Capital × WACC)
A positive EVA means the company generates returns above its cost of capital — actual wealth creation. A negative EVA means the business destroys value even while reporting positive net income. Stern Value Management, EVA's creator, defines it as after-tax operating profit less the cost of all capital employed. This standard is especially demanding for capital-intensive businesses, where large asset bases require substantial returns just to reach break-even.
M&A Analysis
Acquirers strip out a target's existing capital structure before evaluating standalone value. Because the buyer will impose its own financing post-deal, NOPAT provides a clean, debt-neutral view of what the business actually earns from operations.
Damodaran's acquisition framework follows a clear sequence:
- Value bidder and target as standalone entities first
- Measure synergy as the difference between combined and standalone values
- Route operating synergies through NOPAT
- Model financial synergies (debt capacity, tax benefits) separately
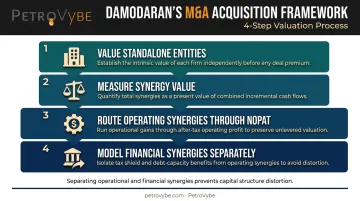
This separation prevents the target's existing debt level from distorting the assessment of operational value.
Capital-Intensive Industries: Oil and Gas Context
In energy, real estate, and manufacturing — where significant debt is common and asset bases are large — NOPAT is the cleaner measure because net income can be heavily distorted by financing decisions.
In oil and gas development, operators typically present EBITDAX (Earnings Before Interest, Taxes, Depreciation, Amortization, and Exploration costs) as the primary measure of operational cash generation. EBITDAX adds back non-cash charges and exploration costs to show a project's cash-generative capacity.
NOPAT, by contrast, applies the tax rate to operating income and does not add back depreciation or exploration expenses. The two metrics are complementary but measure different things.
PetroVybe, a Texas-based upstream development company, uses EBITDAX as its core operational benchmark — reporting 33% EBITDAX-positive operations while exceeding its most recent quarterly plan by 33%. For accredited investor partners, the company provides third-party engineering reserve reports, ProForma P&L statements modeling 10-year MOIC and IRR projections, and K-1 tax documentation.
Knowing where NOPAT ends and EBITDAX begins gives investors a sharper framework for stress-testing project economics from any operator — not just the numbers they're shown, but what those numbers actually measure.
Frequently Asked Questions
How do you calculate net operating profit after tax?
Multiply EBIT (operating income) by (1 − Tax Rate): NOPAT = EBIT × (1 − Tax Rate). Alternatively, start from net income, add back interest expense and tax expense, remove non-operating gains (or add non-operating losses) to reconstruct EBIT, then apply the same (1 − Tax Rate) multiplier.
How do I calculate net operating income (NOI)?
Net operating income equals operating revenue minus operating expenses, before taxes and financing costs. Unlike NOPAT, NOI is a pre-tax, pre-financing measure — it does not apply a tax rate or strip out interest expense.
What is the difference between NOPAT and net income?
Net income includes the tax savings from debt (interest tax shield), non-operating items, and one-time charges. NOPAT strips all of these out to isolate core operating profitability — making it more reliable for cross-company comparisons, while net income remains the right metric for assessing shareholder returns.
Is NOPAT the same as EBIT?
No. EBIT is pre-tax; NOPAT is EBIT after applying the tax rate. NOPAT is often called "tax-effected EBIT" because the only mathematical difference is the (1 − Tax Rate) multiplier.
Why do investors use NOPAT for capital-intensive businesses?
Capital-intensive businesses — energy, real estate, manufacturing — commonly use significant debt, which distorts net income. NOPAT removes the financing effect, showing how efficiently the underlying operations generate profit regardless of how the business is capitalized.
What is the difference between NOPAT and EBITDAX?
EBITDAX adds back interest, taxes, depreciation, amortization, and exploration costs to show cash-generative capacity — it is a pre-tax, upstream-specific metric. NOPAT is tax-effected and debt-neutral but does not add back depreciation or exploration expenses. They serve different analytical purposes and are best read alongside each other.