The challenge is that not all dividends are created equal. A stock yielding 9% looks attractive until the company slashes its payout — and history shows this happens more often than most investors expect. During 2020 alone, 36.1% of S&P 500 High Dividend Index constituents cut their dividends, compared to just 7.2% of Dividend Aristocrats. The difference? Quality metrics that high-yield chasers typically ignore.
This guide covers what actually makes a dividend stock worth owning, five specific stocks built for passive income, how to evaluate them properly, and the tax realities high-income earners must understand before building a dividend portfolio.
Key Takeaways
- Dividend yield is the least important quality metric — payout ratio, free cash flow coverage, and dividend growth history matter more.
- REITs, midstream MLPs, telecom, and infrastructure tend to offer the most reliable high yields.
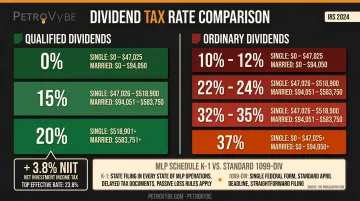
- Qualified dividends are taxed at capital gains rates (0%–20%); unqualified dividends are taxed as ordinary income.
- MLP distributions require Schedule K-1 filings — a meaningful compliance burden at tax time.
- High-income accredited investors can use oil and gas direct investment to offset W2 or capital gains taxes alongside dividend income.
What Are Dividend Stocks and How Do They Generate Passive Income?
Dividend stocks are shares of companies that distribute a portion of profits directly to shareholders on a regular schedule — monthly, quarterly, or annually — without requiring the investor to sell any shares. The income is simply deposited into your brokerage account.
The Two Metrics That Matter Most
Two numbers do most of the diagnostic work when evaluating any dividend stock:
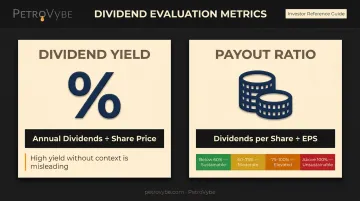
- Dividend yield: Annual dividends per share ÷ current share price. Tells you the cash return as a percentage of your investment — but yield alone is misleading without context.
- Payout ratio: Dividends per share ÷ earnings per share. Tells you how much of company earnings fund the dividend. Morningstar flags ratios above 75% as a warning sign; above 100% means the company pays out more than it earns, which is unsustainable without borrowing or asset sales.
The Yield Trap: Two Very Different Signals
A rising yield can mean two opposite things:
- Profits are growing and the company raised its dividend — a healthy sign
- The stock price has fallen sharply, mechanically inflating the yield — often a danger signal
Kinder Morgan illustrates what happens when the underlying business can't support its payout. In December 2015, the company cut its quarterly dividend by 75% — from $0.51 to $0.125 per share — after financing pressure threatened its investment-grade credit rating.
Investors chasing the high yield before that cut lost on both sides: income dropped and the stock price fell simultaneously. The selections below were screened on payout ratio, earnings stability, and dividend history to avoid repeating that pattern.
Best Dividend Stocks for Passive Income
These five picks were selected on yield, payout sustainability, dividend growth history, and financial stability — not on yield alone. High yield without a sustainable payout is just a dividend waiting to be cut.
Realty Income (NYSE: O)
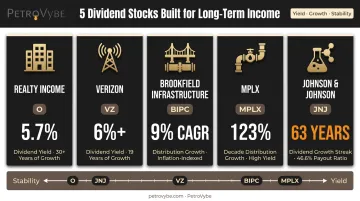
Realty Income is one of the world's largest REITs, owning 15,511 commercial properties across grocery stores, convenience stores, restaurants, and other retail formats. It trades under the registered trademark "The Monthly Dividend Company" — paying shareholders every month rather than quarterly.
What earns it that trademark: 664 consecutive monthly dividends paid and more than 30 years of consecutive dividend increases, with a 4.2% compound annual dividend growth rate since its 1994 NYSE listing. REITs are required by law to distribute at least 90% of taxable income to shareholders, making them structurally high-yield vehicles.
| Metric | Data |
|---|---|
| Reported Dividend Yield | 5.7% (as of July 22, 2025) |
| AFFO Payout Ratio | 75.2% (FY2025: $3.217 dividends / $4.28 AFFO per share) |
| Consecutive Dividend Increases | 30+ years |
| Dividend Growth CAGR | 4.2% since 1994 NYSE listing |
Verizon Communications (NYSE: VZ)
Verizon generates predictable, subscription-based cash flows from mobile and broadband services — the kind of revenue that doesn't evaporate when the economy slows. That predictability funds one of the most reliable dividends in the S&P 500.
In September 2025, Verizon raised its quarterly dividend to $0.69 — its 19th consecutive annual increase. The financial backing is substantial: Verizon produced $20.1 billion in free cash flow in FY2025 against $11.5 billion in cash dividends paid, a 1.75x coverage ratio that leaves significant headroom.
| Metric | Data |
|---|---|
| Reported Dividend Yield | More than 6% (as of September 15, 2025) |
| Free Cash Flow Coverage | 1.75x ($20.1B FCF / $11.5B dividends paid, FY2025) |
| Consecutive Dividend Increases | 19 years |
Brookfield Infrastructure Partners (NYSE: BIP / BIPC)
Brookfield Infrastructure owns utilities, transport networks, midstream pipelines, and data infrastructure globally — secured by long-term contracts and regulated rate structures. Roughly 85% of its FFO is protected from or indexed to inflation, making it one of the more natural hedges against purchasing-power erosion in the dividend universe.
The company has delivered a 9% compound annual distribution growth rate from 2009 to 2024, with a long-term target of 5%–9% annual distribution growth maintained through inflation escalators, volume growth, and expansion projects.
One important note: BIP partnership unitholders receive Schedule K-1 tax forms; BIPC is a separate corporate share class that issues Form 1099-DIV instead — an important distinction for investors concerned about tax filing complexity.
| Metric | Data |
|---|---|
| Annualized Distribution | $1.72 per unit ($0.43 quarterly, as of August 2025) |
| Dividend Growth CAGR | 9% (2009–2024) |
| Long-Term Growth Target | 5%–9% annual distribution growth |
| Inflation Protection | ~85% of FFO protected or inflation-indexed |
MPLX LP (NYSE: MPLX)
MPLX is a midstream master limited partnership that handles the transportation and storage of crude oil, natural gas, and refined products. Its toll-like revenue structure depends on throughput volume, not commodity price swings — a meaningful distinction from upstream producers.
MPLX raised its quarterly distribution to $1.0765 in October 2025 ($4.31 annualized), sustaining a 1.4x distribution coverage ratio for full-year 2025. Its distributions have grown 123.4% over the past decade — from $1.82 per unit in 2015 to $4.066 in 2025 — while maintaining investment-grade credit ratings.
Tax note: MPLX unitholders receive a Schedule K-1 annually (typically mailed mid-March), adding filing complexity in taxable accounts.
| Metric | Data |
|---|---|
| Annualized Distribution | $4.31 per unit (as of Q3 2025 increase) |
| Distribution Coverage Ratio | 1.4x (FY2025) |
| 10-Year Distribution Growth | ~123% ($1.82 → $4.066 per unit, 2015–2025) |
| Credit Quality | Investment grade |
Johnson & Johnson (NYSE: JNJ)
Johnson & Johnson doesn't offer the highest yield on this list — but it offers something more durable: six decades of uninterrupted dividend growth. In April 2025, JNJ announced its 63rd consecutive annual dividend increase — raising the quarterly payout 4.8% to $1.30 per share — cementing its status as a Dividend King (50+ consecutive years of increases).
Its 46.6% payout ratio (2025, per Morningstar) leaves considerable earnings headroom, meaning the dividend isn't under pressure from the business cycle. JNJ fits a portfolio role defined by stability rather than maximum yield — well-suited for conservative investors who want income with minimal cut risk.
| Metric | Data |
|---|---|
| Payout Ratio | 46.6% (2025, Morningstar) |
| Consecutive Dividend Increases | 63 years |
| Dividend King Status | Qualifies (50+ year threshold) |
| Most Recent Increase | 4.8% (April 2025) |
How to Evaluate Dividend Stocks: Key Metrics Every Investor Should Know
Yield, Payout Ratio, and Growth History
A yield significantly above peers is often a warning, not a bargain. As Kinder Morgan demonstrated, a 9%+ yield can precede a 75% dividend cut. A useful benchmark: look for yields that exceed the current 10-year Treasury rate (4.58% as of July 15, 2026) without being more than double that rate , which puts a 4%–9% band around most quality income stocks.
Payout ratio thresholds to watch:
- Below 60% — comfortable, plenty of headroom
- 60%–75% — acceptable for most sectors
- Above 75% — Morningstar's general warning threshold
- Above 100% — unsustainable; company is paying more than it earns
Note that REITs use AFFO (Adjusted Funds From Operations), MLPs use DCF-based coverage, and BIP targets 60%–70% FFO payout. Don't apply an EPS payout threshold to these structures.
Dividend growth history is the best proxy for management discipline. Companies that have raised dividends for 10, 15, or 25+ consecutive years have survived multiple recessions while continuing to grow shareholder payments. The formal designations:
- Dividend Aristocrats — 25+ consecutive years of increases (S&P 500 members only)
- Dividend Kings — 50+ consecutive years of increases
Balance Sheet Health and Stock vs. Fund
Once you're satisfied with yield and growth history, the balance sheet tells you whether those payments are sustainable. High debt is a competing claim on cash — creditors get paid before shareholders in financial stress. Monitor the interest coverage ratio (EBIT / interest payments) and debt-to-equity alongside yield metrics.
The other structural choice is whether to hold individual stocks or dividend ETFs:
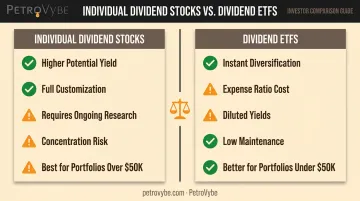
- Individual stocks offer higher potential yield and customization, but require ongoing research and create concentration risk
- Dividend ETFs provide instant diversification but charge expense ratios and dilute yields across the portfolio
- Portfolios under $50,000 typically benefit more from ETF diversification; larger portfolios can absorb the research time required to manage individual positions effectively
Taxes on Dividend Income: What High-Income Earners Need to Know
Qualified vs. Ordinary Dividends
The IRS splits dividends into two categories with very different tax treatment:
Qualified dividends — from U.S. companies where you've held the stock more than 60 days during the 121-day period surrounding the ex-dividend date — are taxed at long-term capital gains rates:
| 2025 Filing Status | 0% Rate | 15% Rate | 20% Rate |
|---|---|---|---|
| Single | Up to $48,350 | $48,351–$533,400 | Above $533,400 |
| Married Filing Jointly | Up to $96,700 | $96,701–$600,050 | Above $600,050 |
| Head of Household | Up to $64,750 | $64,751–$566,700 | Above $566,700 |
Ordinary (unqualified) dividends are taxed at standard income tax rates — which can reach 37% for high earners, compared to 20% for qualified dividends. The Net Investment Income Tax (NIIT) adds another 3.8% on dividend income above $200,000 (single) or $250,000 (married filing jointly), bringing the effective top rate on qualified dividends to 23.8% for high earners.
The DRIP and K-1 Complications
One tax reality many dividend investors miss: dividends are taxable in the year received — even if you reinvest them automatically through a DRIP. The IRS treats reinvested dividends as income at fair market value. The only way to fully defer dividend taxation is through IRAs and 401(k)s, which limits the scale of tax-free dividend income for high earners with contribution caps.
MLP investors face a related but separate complication. MPLX and BIP partnership unitholders receive Schedule K-1 forms (typically in mid-March) rather than standard 1099-DIVs, which can delay tax filing and require additional professional preparation for investors holding these in taxable brokerage accounts.
A Structurally Different Option for High-Income Investors
For accredited investors carrying a heavy W2 or capital gains tax burden, dividend income has a structural ceiling: it cannot offset active income, regardless of the preferential rate.
Direct oil and gas development investments work differently. Under IRC Section 263(c), Intangible Drilling Costs (IDC) may be elected as current business expenses — and for working interests that don't limit liability, the passive activity rules don't apply, meaning these deductions can potentially offset W2 wages and capital gains in the year of investment.
PetroVybe, a Texas-based natural gas development company, structures direct partnership investments to utilize this mechanism. PetroVybe partners achieved a 94% tax deduction against active income in 2025 and a 91% deduction in 2024, applicable to W2 earnings and capital gains. On a $100,000 investment, that translates to $91,000–$94,000 in potential deductions, with total deductions approaching 100% over the investment's life. No publicly traded dividend stock offers a mechanism like this — which is why high-income investors increasingly pair dividend portfolios with direct energy investments for tax efficiency. Consult a qualified tax advisor to evaluate how this applies to your specific situation.
Conclusion
The best dividend stocks for passive income aren't the highest-yielding ones — they're the ones with sustainable payouts, consistent growth histories, strong balance sheets, and alignment with your tax situation. Realty Income, Verizon, Brookfield Infrastructure, MPLX, and Johnson & Johnson each represent a different point on the yield-stability spectrum, and a diversified position across several gives you both income and resilience.
Before building a dividend portfolio, assess your full tax picture. For most investors, dividend income is a sound, reliable strategy. For accredited investors carrying a heavy W2 or capital gains tax burden with $100K+ in liquidity, a different vehicle may do more work.
PetroVybe's direct natural gas development partnerships offer a strong complement to a dividend portfolio:
- 10-year target MOIC of approximately 2.2–5.8x
- Projected monthly passive distributions exceeding $10,000 at peak production
- First-year tax deductions against active income that dividend stocks cannot provide
Connect with the PetroVybe team to learn more.
Frequently Asked Questions
How do I make $1,000 a month in dividends?
At a 4% yield, you need roughly $300,000 invested; at 5%, approximately $240,000; at 6%, around $200,000. A DRIP strategy can accelerate compounding toward that goal, but dividend income is taxable in the year received, so your after-tax monthly figure will be lower than the gross.
What is the 25% dividend rule?
This guideline holds that no single dividend stock should exceed 25% of a portfolio, limiting concentration risk if one company cuts its payout. Some analysts also apply payout ratio thresholds near this range as a rough screen for dividend safety — though neither is a universal standard.
What is a good dividend yield for passive income?
Quality income-focused stocks typically yield 3%–7%. A useful benchmark: look for yields above the 10-year Treasury rate (currently 4.58%) without being more than double it. Yields far above that range often signal payout risk rather than exceptional value.
Are dividend stocks a reliable source of passive income?
More reliable than most income sources, but not guaranteed — 36.1% of S&P 500 High Dividend Index constituents cut or suspended payouts in 2020. Companies with long dividend growth histories, low payout ratios, and sector diversification hold up significantly better through downturns.
What sectors offer the best dividend stocks for passive income?
REITs, midstream energy MLPs, utilities, telecom, and consumer staples have historically offered the highest and most stable payouts. Tax treatment varies by structure: MLPs require K-1 filings, and REIT distributions typically don't qualify for preferential dividend tax rates.
How does dividend income compare to other passive income strategies for high-income earners?
Dividend income is fully taxable in the year received, either at capital gains rates for qualified dividends, or ordinary income rates for unqualified ones. It cannot offset your W2 or capital gains tax liability. Direct oil and gas investments, by contrast, can generate IDC deductions applicable against active income — a structural feature dividend stocks don't offer.