Introduction
Most accredited investors own stocks, bonds, and real estate. Far fewer apply a structured discipline to how they decide where capital goes, when to commit it, and in what proportion across all asset classes. That gap is what asset investment planning (AIP) is designed to close.
Without a deliberate planning framework, capital follows the most recent headline or the highest short-term yield. With one, decisions are grounded in evidence: asset condition, risk profile, lifecycle cost, and alignment with long-term goals.
This guide covers the full AIP framework:
- What AIP is and how it works
- The four major asset categories
- Key elements of a sound plan
- Why real tangible assets deserve serious consideration
- How to evaluate any opportunity
- How tax strategy can meaningfully improve your net returns
Key Takeaways
- AIP is a structured, forward-looking approach to allocating capital across assets to minimize risk and maximize long-term value
- Complete plans address goals, risk, lifecycle costs, scenario modeling, and ongoing recalibration
- Real, tangible assets like energy infrastructure and oil and gas development offer inflation protection and cash flow that stocks and bonds cannot replicate
- Tax efficiency — including 91–94% deductions available through direct oil and gas participation — is a measurable component of total return, not an afterthought
What Is Asset Investment Planning?
Asset investment planning is the ongoing practice of deciding, over a medium-to-long time horizon, how to allocate capital across assets to minimize total lifecycle costs, control risk, and achieve specific financial or operational goals.
That definition matters because it draws a clear line between two distinct disciplines. Where asset management describes and maintains what you currently own, asset investment planning looks forward — evaluating future scenarios to determine where new capital should be deployed, when, and at what scale. The distinction comes down to orientation: one documents the present, the other engineers the future.
AIP operates across two contexts. In the enterprise context, corporations and utilities use it to allocate capital expenditure across large physical asset portfolios. In the individual investor context, it describes how accredited investors and family offices decide how much of their net worth to deploy into which asset classes, for how long, and with what exit strategy.
This guide focuses on the individual investor lens.
The Core Question AIP Answers
Given a finite pool of capital, competing risks, inflation pressure, and varying time horizons, which assets should you hold, in what proportion, and with what exit strategy?
Without a framework for that question, reactive investing takes over. Capital follows the most recent narrative: the highest short-term yield, a single advisor's recommendation, or whatever performed best last quarter. With AIP, decisions are grounded in evidence instead. Asset quality, risk profile, and long-term alignment replace short-term noise.
The urgency of this discipline is growing. According to UBS's 2025 Global Family Office Report, family offices averaged 44% allocation to alternative assets in 2024 — up from 42% in 2023 — with private equity, real estate, and infrastructure each carrying meaningful weight. High-net-worth capital is moving systematically outside traditional equities. Individual accredited investors without a parallel framework are making asset class decisions by default.
The 4 Types of Assets Every Investor Should Understand
Four broadly recognized asset categories form the foundation of any investment plan:
| Asset Type | Examples | Key Characteristic |
|---|---|---|
| Financial Assets | Stocks, bonds, cash equivalents | Liquid, but correlated and market-volatile |
| Real/Tangible Assets | Oil and gas, real estate, commodities, infrastructure | Less liquid, inflation-resistant, cash-flow generative |
| Intangible Assets | IP, patents, brand value | Primarily relevant for business owners |
| Human Capital | Earning power over a career | The asset most investors undervalue in planning |

Understanding this taxonomy matters because the mix between financial and real assets is the single most consequential planning decision for most accredited investors.
Financial assets are efficient and liquid but tend to move together — they're correlated. During inflationary periods, that correlation works against you. A CFA Institute analysis covering 1872–2023 found that commodities averaged 13.1% returns during high-inflation periods, compared with 8.4% for equities and just 3.1% for bonds.
Real assets produce returns that are structurally different. Their value tends to move with prices rather than against them. They generate cash income independent of equity markets. And direct participation in certain real asset categories — particularly oil and gas development — carries significant tax advantages that no financial asset can replicate.
Buying publicly traded energy equities or pipeline ETFs means buying maturity, not growth. By the time shares trade on public markets, the value creation phase has already occurred. PetroVybe, a Texas-based natural gas development company, positions accredited investors at the upstream entry point — before reserves are appraised, before production peaks, and before the premium is priced in.
AIP at the individual level is primarily about optimizing the allocation between these categories based on your income profile, tax situation, time horizon, and risk tolerance. The right mix, not the right single pick, is what determines long-term outcomes.
Key Elements of a Good Asset Investment Plan
Align on Goals With Measurable Outcomes
Effective AIP begins with a clear articulation of what you're trying to achieve — not just "growth," but specific, measurable targets.
Examples of quantified goals:
- A target after-tax income level within a defined period
- A wealth multiple over a specific horizon (2x–5x in 10 years)
- A defined reduction in annual tax burden
Without quantified goals, there's no basis for evaluating whether any investment decision is correct. Vague intentions aren't a strategy — and they can't tell you whether a specific investment decision is right or wrong.
Segment goals by time horizon:
- Near-term (0–2 years): Liquidity needs and capital preservation
- Medium-term (3–7 years): Income generation and portfolio diversification
- Long-term (7+ years): Legacy wealth, compound growth, and exit objectives
PetroVybe's investment thesis targets a 10-year MOIC of approximately 2.2x–5.8x with an IRR target of around 26%. That's what quantified, time-horizon-anchored goal-setting looks like in practice.
Define and Quantify Risk
Risk in AIP is not just volatility. A complete risk framework addresses:
- Permanent capital loss — the risk that an investment never recovers
- Inflation-adjusted return shortfall — earning a return that doesn't keep pace with purchasing power erosion
- Liquidity risk — the inability to access capital when needed
- Concentration risk — overexposure to correlated assets that fall together
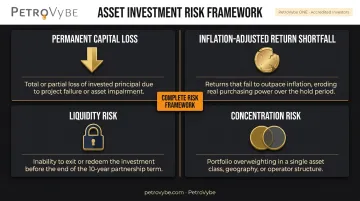
A sound plan assigns a risk profile to each asset position, not just the portfolio as a whole.
One risk that often goes unaccounted for is the cost of inaction. Deferring a capital deployment decision has its own risk profile, particularly for income-generating real assets where early entry captures the most value creation. Time not invested in a producing asset is time without production income.
PetroVybe communicates geological risk with unusual specificity: Chief Geophysicist Michael Stamatedes carries a 75.2% career hit rate on profitable well location selection across a 48-year career, compared to an industry peer average of below 40%. That's not a qualitative claim; it's a quantified risk reduction metric.
Lifecycle Cost and Return Modeling
Every asset has a lifecycle with distinct phases: acquisition, income generation, maintenance or reinvestment, and exit. A sound investment plan models cash flows across the entire lifecycle, not just the entry price and projected yield. The most important discipline is distinguishing between gross and net return:
- Gross return: The headline yield or projected income before fees, taxes, and inflation
- Net IRR and MOIC: What the investor actually receives after all costs
Sophisticated investors evaluate net IRR (Internal Rate of Return) and net MOIC (Multiple on Invested Capital). Gross projections can look compelling; net figures tell the real story. The SEC's marketing rules require that net performance be presented alongside gross figures, a regulatory requirement that underscores how much the distinction matters.
Scenario Planning and Stress Testing
No single projection of the future is reliable. Good AIP requires modeling at least three scenarios: base case, upside, and downside.
Variables worth modeling across scenarios:
- Commodity price shifts (for real asset positions)
- Interest rate changes (for leveraged investments)
- Regulatory environment changes
- Unexpected capital needs or liquidity events
PetroVybe's SCALE strategy explicitly describes three deployment postures: in weak environments, capital deployment slows and becomes highly selective; in stable environments, disciplined growth continues; in strong environments, the company accelerates into pre-underwritten opportunities. The key insight is that scenario planning doesn't just protect the downside. It also reveals the value of timing and the cost of deferral that reactive investors consistently underestimate.
Execution and Ongoing Recalibration
AIP is not a one-time event. Plans should be reviewed at defined intervals, quarterly or annually, and updated based on actual performance, changes in personal financial circumstances, and shifts in the macroeconomic environment.
The most common planning failure is not a bad initial decision. It's the absence of a feedback loop. Capital gets deployed, time passes, and no one revisits whether the original assumptions still hold.
Why Real Assets Deserve a Central Role in Your Investment Plan
The Inflation Case
Real assets are physical assets that produce economic value — oil and gas reserves, productive land, infrastructure, commodities. Their value and income tend to move with prices rather than against them, which is the defining characteristic that makes them structurally different from financial assets during inflationary periods.
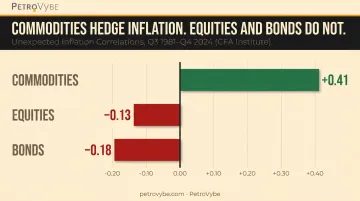
CFA Institute research found unexpected-inflation correlations of +0.41 for commodities versus -0.13 for equities and -0.18 for bonds across Q3 1981–Q4 2024. When inflation surprises to the upside, real assets tend to hold value; financial assets tend to erode it.
The Energy Demand Tailwind
The numbers tell the story directly: US data centers used approximately 176 TWh in 2023 and are projected to consume 325–580 TWh by 2028 — a potential tripling of demand in five years. AI computing, grid electrification, and reshoring of manufacturing are all driving demand for dispatchable electricity, and natural gas is the dominant fuel serving that need.
Investors in producing energy assets stand to benefit directly from this demand curve. PetroVybe's development projects in South Texas — specifically the Wilcox formation in Lavaca County — produce Natural Gas Liquids (NGLs), which command premium pricing at a lower extraction cost than dry gas, improving per-unit economics throughout the production phase.
The Cash Flow Advantage
Unlike most equity investments, direct positions in operating infrastructure or producing wells generate income from the first day of production. This is passive income that doesn't require the investor's active management time.
PetroVybe's projected distributions on a single $100,000 unit illustrate the structure:
- Peak monthly distributions: $10,000+ per month during peak production
- Total projected distributions: ~$326,000 over five years
- Hold period before first distribution: approximately 2–3 years
That 2–3 year wait is the honest trade-off for entering at the value-creation stage rather than buying into a mature, already-priced asset.
The Liquidity Trade-Off
Real assets are less liquid than publicly traded securities. That's a real constraint, and any investor considering a real asset position should account for it honestly.
The illiquidity premium is part of what makes them attractive — private infrastructure investments can offer yield premiums over comparable liquid instruments, as a function of the complexity and lock-up involved. The right sizing for real asset positions depends on the investor's total portfolio, time horizon, and accessible liquidity outside the investment.
How to Evaluate an Asset Investment Opportunity
The Due Diligence Framework
Three core areas deserve scrutiny before committing capital to any real asset opportunity:
1. Operator Track Record
- Who is managing the asset, and what have they achieved with similar assets?
- Are those results independently verifiable?
- PetroVybe's leadership team example: COO Blaine Yeary scaled a $5 billion asset from zero to 35,000 BOEPD over eight years; CFO Clayton Riddle delivered a 9x EBITDA increase at PEDEVCO. These are specific, verifiable metrics — not general claims.
2. Asset Quality and Condition
- Is the underlying asset in a productive formation?
- What is the realistic production trajectory?
- How does the forecasted decline curve compare to the nearest producing wells?
3. Financial Structure
- What are the fee layers, working interest arrangements, and promote structures?
- How do these affect the investor's net return, not the gross projection?
- Does the project rely on an exit event to deliver projected returns? (A high-risk structure for direct-participation oil and gas.)
Third-Party Validation
Completing the framework above is only half the work. Verifying what operators claim is the other half.
A credible opportunity will have independent engineering reports, third-party reserve valuations, and transparent reporting — not just operator-provided projections. FINRA Rule 2310 requires broker-dealer members in direct participation programs to conduct reasonable due diligence on material facts, sponsor experience, and program structure. Investors without a broker intermediary should apply the same standard independently.
As a concrete example of what this looks like in practice: PetroVybe's offering includes a $48MM proved reserves valuation (PV-09 basis) from a licensed third-party engineering firm, three separate engineering reports across 264 development locations, and KYB compliance verification with no sanctions or adverse media. Eight verified investor reviews on Invest Clearly — with named testimonials citing specific tax outcomes and reporting quality — provide the kind of independent signal no operator can fabricate on its own.
Key Return Metrics
Always evaluate opportunities on a net, after-tax basis. Three metrics do most of the work:
- IRR (Internal Rate of Return): Annualized return implied by projected cash flows — the right tool for comparing opportunities with different timing profiles
- MOIC (Multiple on Invested Capital): Total return as a multiple of capital deployed over the holding period. This captures absolute wealth creation that IRR alone can obscure.
- Payback period: How long until original capital is recovered — critical for liquidity planning in long-hold structures like direct participation programs
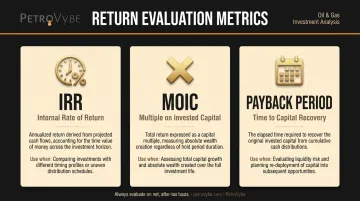
Always use net figures: after fees, taxes, and inflation. Gross projections are a starting point for analysis, not the conclusion of it.
Tax Efficiency: The Often-Overlooked Advantage of Real Asset Investing
Tax treatment is a core component of total return in any asset investment plan — not an afterthought. Different asset classes carry dramatically different tax profiles, and failing to account for those differences means consistently underestimating the true cost of certain investments and the true value of others.
What Makes Oil and Gas Different
Direct participation in oil and gas development offers deductions that no other asset class provides, rooted in IRC Section 263(c), which authorizes taxpayers to elect to expense Intangible Drilling Costs (IDC) — the labor, fuel, supplies, and other costs that go into drilling a well but carry no salvage value.
The key distinction from real estate:
- Real estate depreciation is generally a passive deduction — it can only offset passive income, not W-2 wages or capital gains
- Oil and gas IDC deductions — for qualifying working interests — are treated as nonpassive, meaning they can offset active income including W-2 earnings and capital gains
No other major asset class in an accredited investor's portfolio carries this nonpassive treatment — which is precisely what makes IDC deductions a qualitatively different tool for high-income earners.
How the Deduction Works in Practice
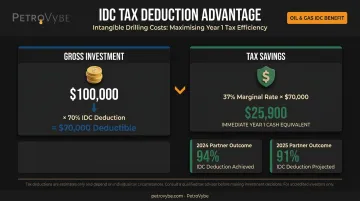
For a direct-participation oil and gas development project, IDC deductions typically represent 60–80% of invested capital. On a $100,000 investment, that translates to a $60,000–$80,000 deduction deductible against ordinary income in that same tax year.
PetroVybe structures its partnerships to deliver approximately 70% in Year 1, with up to 100% total deduction over the investment lifecycle through IDC plus depletion allowances and depreciation on tangible assets. In practice, partners have achieved:
- 94% tax deduction against active income in 2024
- 91% tax deduction against active income in 2025
One verified partner, Nizar A., reported the elimination of a $30,000 tax liability through this structure. These are documented outcomes, not projections.
Investors can take the deduction as a full K-1 deduction in Year 1 or amortized equally over five years — whichever better fits their tax situation. Consult a qualified tax advisor for how these rules apply to your specific circumstances, as basis, at-risk rules, excess business loss limitations, and potential AMT adjustments can affect the current-year deduction amount.
Why Tax Efficiency Compounds
A dollar saved in taxes in Year 1 is a dollar that can be redeployed into additional income-generating assets. Investors who build tax planning into their asset investment plan from the beginning — rather than managing taxes reactively — achieve stronger net returns over a 10-year horizon.
Evaluating any real asset on a gross yield basis misses this entirely. For someone in a 37% marginal bracket, a $70,000 first-year IDC deduction on a $100,000 investment represents approximately $25,900 in immediate tax savings — a cash-on-cash-equivalent return from the deduction alone, before a single dollar of production income.
Frequently Asked Questions
What are the key elements of good asset planning?
A sound asset investment plan covers five essentials: clear goal-setting with measurable outcomes, risk quantification across multiple risk types, lifecycle cost and return modeling, scenario planning for multiple futures, and a disciplined recalibration process. Each element depends on the others — weakness in one undermines the whole framework.
What is Maximo Asset Investment Planning?
IBM Maximo Asset Investment Planning is an enterprise software module used by corporations and utilities (power grid operators, industrial manufacturers) to optimize capital expenditure across large physical asset portfolios. It's distinct from individual investor-level AIP, which focuses on allocating personal capital across asset classes to build wealth.
What are the 4 types of assets?
Financial assets (stocks, bonds, cash), real/tangible assets (real estate, commodities, oil and gas, infrastructure), intangible assets (intellectual property, brand value), and human capital (your earning power over a career). For accredited investors, the most impactful planning decision is usually how to balance financial and real assets.
What is the difference between asset management and asset investment planning?
Asset management describes and maintains what you currently own. Asset investment planning looks forward — simulating future scenarios to determine where new capital should be deployed, when, and at what scale. Management is present-tense; planning is future-tense.
How do accredited investors get started with real asset investment planning?
Start by defining quantified financial goals and a time horizon, then assess your current portfolio concentration and tax exposure. From there, identify real asset opportunities (direct participation in energy development, for example) that complement existing holdings and improve your after-tax return profile.
What return should I realistically expect from a real asset investment?
Returns vary by asset class, operator, market conditions, and project structure. Evaluate net IRR and MOIC over the full investment horizon rather than headline yield, and always request independent engineering validation before committing capital — projections reflect modeled scenarios, not guaranteed outcomes.