
Introduction
For decades, bonds were the anchor of "safe" portfolios. The logic was clean: when stocks fell, bonds rose. That relationship held for over 20 years — and then 2022 happened.
The Federal Reserve raised rates by 525 basis points in roughly 16 months. The Bloomberg U.S. Aggregate Bond Index returned -13.01%. The S&P 500 lost -18.11%. Investors holding traditional 60/40 portfolios absorbed losses on both sides simultaneously — a scenario most allocation models hadn't stress-tested for.
That episode didn't kill fixed income. But it exposed assumptions that had gone unexamined for a generation: that bonds reliably cushion stock losses, that fixed payments preserve purchasing power, and that more bonds always means less risk.
This guide is for accredited investors and high-income earners who want to understand what fixed income delivers — and where it falls short — in a modern portfolio. It covers allocation frameworks, goal-based approaches, underappreciated risks, and how real assets are filling roles that bonds no longer reliably serve.
Key Takeaways
- The 2022 simultaneous stock-bond drawdown exposed how fragile the traditional negative correlation assumption had become
- Fixed income interest is taxed as ordinary income — the worst tax treatment available, particularly painful for high earners
- Rules like 60/40 and "100 minus age" are starting points, not complete portfolio strategies
- Goal-based frameworks — risk reduction, total return, or income — offer more precision than blanket percentages
- Accredited investors can access real asset alternatives that outperform bonds on inflation resistance and tax efficiency
What Is Fixed Income Asset Allocation?
Fixed income refers to investments that pay a predetermined stream of interest or dividends over a set period, with principal returned at maturity. The category includes government bonds, corporate bonds, Treasury securities, CDs, and preferred stock.
Asset allocation is the deliberate decision about what percentage of a portfolio lives in fixed income versus equities, alternatives, or cash. That split has historically been treated as the primary lever for managing portfolio risk.
The Traditional Logic
The case for bonds in a portfolio was straightforward:
- They generate predictable income
- Their prices historically moved opposite to stocks (negative correlation)
- They provided a cushion during equity downturns
- They suited conservative investors, retirees, and those in wealth-distribution phases
For over 20 years following the late 1990s, that logic worked. Vanguard Research found the average stock-bond correlation was -0.32 after 2000, compared to +0.42 in 1992–1999. The negative regime created a consistent hedge — and 60/40 portfolios benefited from it for two full decades.
That changed around 2021, when rising inflation forced the Fed into its most aggressive rate-hiking cycle in four decades — flipping the stock-bond correlation positive and exposing the assumptions built into traditional allocation models.
Why Traditional Fixed Income Allocation Is Being Rethought
The Correlation Regime Shift
Vanguard's research identified trailing inflation as the largest driver of stock-bond correlation, accounting for 55% of variable importance in their model. When inflation is low and stable, growth shocks dominate — stocks and bonds diverge. When inflation surges, both assets get hurt simultaneously through higher expected rates and discount rates.
Post-2020 inflation triggered exactly that dynamic. By mid-2021, 60-day correlations had turned positive. The 20-year diversification regime was cracking before 2022 began.
2022: The Case Study That Changed the Conversation
| Asset | 2022 Total Return |
|---|---|
| Bloomberg U.S. Aggregate Bond Index | -13.01% |
| S&P 500 (dividends reinvested) | -18.11% |
| Simplified 60/40 blend | ≈ -16.1% |
A traditional 60/40 investor lost roughly 16% while holding what was supposed to be a "balanced" portfolio. The iShares 20+ Year Treasury Bond ETF (TLT) alone lost -34.68% on NAV in 2022 — illustrating how duration amplified the damage from rapid rate hikes.
The Inflation Problem
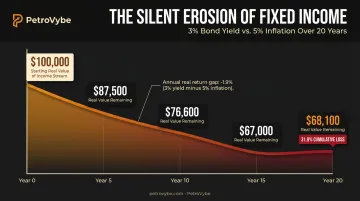
Fixed interest payments lose real purchasing power during inflationary periods. Consider this comparison:
| Year | Annual-Average CPI | Avg. 10-Year Treasury Yield | Real Gap |
|---|---|---|---|
| 2021 | 4.7% | 1.45% | -3.25 pts |
| 2022 | 8.0% | 2.95% | -5.05 pts |
| 2023 | 4.1% | 3.96% | -0.14 pts |
A bond paying 3% during a 5% inflation period generates a real annual loss of approximately -1.9%. Over 20 years at those rates, the purchasing power of that income stream declines by 31.9% — a slow, steady erosion that most allocation models never factor in.
Inflation alone doesn't tell the full story. Taxation compounds the problem further.
The Tax Drag Nobody Talks About
Bond interest is taxed as ordinary income — the highest federal rate, not at favorable long-term capital gains rates. For high earners, the math is sobering:
| Tax Scenario | Combined Rate | After-Tax Yield on a 5% Bond |
|---|---|---|
| Federal only (37%) | 37.0% | 3.15% |
| Federal + NIIT (3.8%) | 40.8% | 2.96% |
| Federal + NIIT + California | 54.1% | 2.30% |
| Federal + NIIT + NYC combined | 55.6% | 2.22% |
A top-bracket investor in California or New York collecting a 5% yield is netting somewhere between 2.2% and 2.96% after tax — before accounting for inflation. That's a meaningful gap from the headline yield that most allocation discussions never address.
Common Fixed Income Allocation Frameworks Explained
The 60/40 Portfolio
The 60% equity / 40% bond split became the default "balanced" portfolio for institutional and retail investors alike. It worked well during the 2000–2020 negative correlation regime — and Morningstar reports the framework gained more than 15% in both 2023 and 2024 after 2022's losses.
Many investors treat 60/40 as a destination rather than a starting point. The framework has no mechanism for adjusting to inflation regimes, tax situations, or individual income needs.
The "100 Minus Age" Rule
This heuristic suggests holding your age as a percentage in bonds — so a 60-year-old would hold 60% fixed income. Morningstar notes the rule was designed as a simple guide, not a financial plan.
It fails on several counts:
- Life expectancy: The CDC reports 2024 U.S. life expectancy at 79.0 years (81.4 for women). A 60-year-old may need a portfolio to last 25+ more years — a horizon that a bond-heavy allocation poorly serves
- Inflation exposure: Higher bond allocations increase purchasing-power erosion over time
- Tax blindness: The formula entirely ignores whether bond income is tax-efficient for a given investor's situation
Multi-Asset Frameworks (70/20/10, 40/40/20, 25/25/25/25)
These models distribute capital across equities, bonds, alternatives, and cash — treating fixed income as one component of a diversified system rather than the default risk buffer. The core argument is that over-concentration in bonds creates its own risks:
- Inflation erosion that compounds quietly over long hold periods
- Interest rate sensitivity that can produce sharp, unexpected drawdowns
- Tax drag on bond income that accumulates year over year
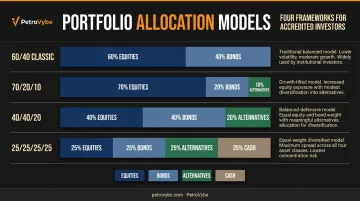
No single model prescribes the "right" percentages. What they share is a rejection of the binary stock-bond tradeoff as the only design available — and an acknowledgment that fixed income is a tool, not a default.
Goal-Based Fixed Income Allocation: Matching Strategy to Need
Rather than asking "what percentage should I hold in bonds?", a more useful question is: what is the bond position actually supposed to do?
Bonds for Risk Diversification
High-quality bonds (Treasuries, mortgage-backed securities, core bond funds) have historically cushioned equity drawdowns — but only when stock-bond correlation is negative. In a positive correlation environment like 2022, this strategy fails.
Investors relying on bonds primarily for volatility management should stress-test their portfolio for scenarios where both assets fall simultaneously. That scenario is no longer hypothetical.
Bonds for Total Return
A blended approach can generate returns exceeding core bonds without full equity exposure. Common combinations include:
- Investment-grade corporates — BBB-rated bonds currently yielding ~5.50%
- High-yield debt — currently offering roughly 7.09% yield, a 1.59-point premium over BBB corporates
- Emerging market bonds — additional return potential with currency and sovereign risk layered in
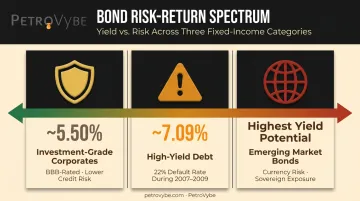
That spread looks attractive until credit cycles turn. Fitch documented a 22% cumulative U.S. high-yield default rate during 2007–2009 — a reminder that the premium exists for a reason.
Bonds for Income Generation
Retirees and those in wealth-distribution phases often need bond income to meet regular spending needs. Reaching for yield by moving into lower-rated instruments introduces credit and default risk that investors must explicitly accept — not just acknowledge in passing.
Diversified credit exposure and multi-sector income funds offer lower concentration risk than heavy bets on single high-yield issuers.
Beyond Bonds: How Real Assets Fit Into a Rethought Portfolio
When inflation rises, fixed interest payments lose ground. Bonds can't fix this — the coupon is fixed by design.
Real assets — commodities, infrastructure, real estate, and direct energy development — generate income that can move with commodity prices and inflation. The mechanism is different: instead of a contractual coupon, you receive a share of production revenue. When energy prices rise (which often coincides with inflationary periods), income from production-linked assets tends to rise alongside.
What Accredited Investors Can Access
Private placement investments in oil and gas development offer income streams, potential capital appreciation, and tax advantages unavailable through bonds or public equities.
Under IRC Section 263(c), Intangible Drilling Costs (IDCs) — typically 60–80% of invested capital in a development project — can be deducted against ordinary income in the year incurred, including W2 earnings and capital gains.
Unlike real estate deductions — which are restricted to passive income under standard passive loss rules — IDC deductions apply directly against active income.
PetroVybe, a Texas-based private oil and gas development company, operates this type of structure for accredited investors. Key details of their PetroVybe ONE partnership:
- Minimum investment: $100,000 per unit
- Hold period: 2–3 years before first distribution, 10-year window for full return realization
- Projected distributions: Peaking at $10,000+/month per unit during peak production
- Tax deductions: Partners received 91–94% deductions against active income in 2024–2025
- MOIC target: ~2.2–5.8x over 10 years; ~26% target IRR (both forecast-dependent)
- Reserves: $48MM proved reserves valuation (PV-09, independent engineering)
For high-income W2 earners in the 37% federal bracket, a 5% bond nets under 3.15% after tax. The contrast with an IDC deduction structure is concrete — though the investment thesis must stand on its operational merits, not the tax benefit alone.
Trade-Offs to Understand Clearly
Real assets are not bonds. The differences matter:
- Revenue moves with oil and gas prices — no operator controls the commodity market
- Drilling outcomes and reserve estimates carry inherent uncertainty that bonds don't
- Capital is committed for years with no secondary market to exit early
- Entry requires accredited investor status, third-party verification, and PPM review

For investors with long time horizons and high active income, the income and tax-efficiency roles traditionally assigned to bonds can be served by a different class of assets entirely — one that pays from production rather than promises.
Frequently Asked Questions
What do the 70/20/10, 40/40/20, and 25/25/25/25 allocation rules mean for fixed income?
These are multi-asset diversification frameworks that spread capital across stocks, bonds, alternatives, and cash — with fixed income as one component rather than the dominant position. They represent a philosophy of distributing risk across asset classes rather than relying on a binary stock-bond split.
What is Warren Buffett's recommended allocation between stocks and fixed income?
Buffett's 2013 Berkshire Hathaway shareholder letter recommended 90% in a low-cost S&P 500 index fund and 10% in short-term government bonds — specific to his wife's bequest, not a universal prescription. The reasoning: productive assets deliver superior long-term returns over fixed interest instruments.
Is fixed income still a good investment in a high-inflation environment?
Traditional fixed income underperforms during high inflation because fixed payments lose purchasing power. TIPS offer some protection by adjusting principal for CPI changes, but they carry real-rate risk and can have negative real yields. Evaluate real (inflation-adjusted) returns, not just nominal yield.
What percentage of my portfolio should be in fixed income?
The right allocation depends on your investment goals, time horizon, tax situation, and risk tolerance — no single number fits all investors. Accredited investors in particular should assess whether alternatives can serve the income and stability roles traditionally assigned to bonds more efficiently.
What are the main risks of fixed income investing?
Four key risks: interest rate risk (rising rates reduce bond prices), inflation risk (fixed payments lose real value over time), credit/default risk (issuers may fail to pay), and liquidity risk (corporate and municipal bonds can be hard to sell at fair value before maturity).
How does the stock-bond correlation affect fixed income allocation?
When stocks and bonds move in opposite directions, bonds hedge equity risk effectively. When correlation turns positive — as it did post-2021 — both assets can decline simultaneously. That positive correlation environment undermines the primary justification for large fixed income allocations in balanced portfolios.