Introduction
Asset yield looks deceptively simple: divide income by asset value, multiply by 100, done. Accredited investors who stop there make poor allocation decisions — sometimes costly ones.
The real complexity lies beneath the percentage. A 6% yield on a bond, a 6% cap rate on real estate, and a 6% dividend yield are not the same number dressed in different clothes. They measure different things, use different inputs, and carry different tax implications. Conflating them is a foundational error in investment analysis.
This article covers what asset yield actually means, how to calculate it across asset classes, where it diverges from total return, and where investors consistently misread it. For accredited investors evaluating income-producing assets — including direct participation structures in energy development — these distinctions are the baseline.
Key Takeaways
- Asset yield measures income generated relative to cost or current value, expressed as a percentage
- Yield calculations vary by asset class; cross-asset comparisons require knowing what each figure actually measures
- Yield captures income only; total return includes capital appreciation or depreciation
- Higher yield typically signals higher risk, not higher quality
- Tax treatment materially affects effective yield; after-tax figures often differ significantly from headline percentages
What Is Asset Yield?
Asset yield is the income an investment generates over a given period, expressed as a percentage of its cost or current market value. The formula is simple; how you apply it depends on which version you're using and what you're actually trying to measure.
Cost Yield vs. Current Yield
Two versions of the same metric produce very different numbers:
- Cost yield — income divided by your original purchase price
- Current yield — income divided by the asset's present market value
If you bought a bond at $900 and it now trades at $1,100, your cost yield and current yield are different figures even though the coupon payment hasn't changed. Neither is wrong — they answer different questions. Cost yield measures what your original capital is earning; current yield reflects what the market is pricing today.
One more distinction worth building into your analysis: gross yield is calculated before fees, taxes, and expenses, while net yield deducts those costs. For real-world decisions, net yield is the number that matters — gross yield is where the calculation starts, not where it ends.
Yield Is Dynamic, Not Static
Yield is a derived metric, not a fixed property of an asset. It shifts as:
- Market prices move (changing the denominator)
- Income distributions change (changing the numerator)
- The investor's cost basis changes through reinvestment or partial disposition
An asset yielding 5% today may yield 3.5% in 18 months if its price rises significantly — even if it hasn't paid a single dollar more in income.
Yield on Earning Assets (Institutional Context)
In institutional finance, "yield on earning assets" has a specific meaning: total interest income divided by average earning assets. Banks and regulators use it to assess how efficiently a financial entity's asset base generates income. The FDIC reported that community bank average earning-asset yield reached 5.80% in Q3 2025 — a useful benchmark for understanding how capital deployment efficiency is measured at scale.
How to Calculate Asset Yield
The universal base formula:
Yield (%) = Net Income Generated ÷ Cost (or Current Value) of Asset × 100
From there, the inputs vary significantly by asset class.
Stock Dividend Yield
For an equity holding paying $4.00 per share annually with a current price of $80:
Dividend Yield = $4.00 ÷ $80.00 × 100 = 5.0%
If you purchased at $50, your cost yield is 8.0% — a meaningfully different figure that reflects your actual income return on deployed capital.
Beyond dividends, earnings yield (EPS ÷ current price) gives a broader view of profitability per dollar invested and is the inverse of the P/E ratio. Growth-oriented stocks may show low dividend yield but substantial earnings yield and total return potential.
Bond Yield Measures
Bonds require three distinct calculations, each answering a different question:
| Measure | Formula | What It Captures |
|---|---|---|
| Nominal yield | Annual coupon ÷ face value | Income relative to par |
| Current yield | Annual coupon ÷ current price | Income relative to market price |
| Yield to maturity (YTM) | Discount rate equating price with all future cash flows | Full return through maturity |
| Yield to worst (YTW) | Lowest yield across maturity and call dates | Conservative scenario planning |
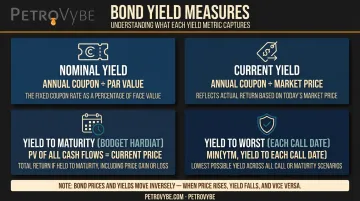
FINRA defines YTM as the discount rate at which all future coupon and principal payments equal the bond's current price — making it the most complete measure for comparing bonds with different coupons and maturities.
One dynamic investors frequently overlook: bond prices and yields move inversely. When market rates rise, existing fixed-rate bond prices fall — raising their current yield. When rates fall, prices rise and yields compress. Investors comparing yield snapshots from different time periods often miss this dynamic entirely.
Real Estate & Direct Asset Yield
For income-producing real estate, the equivalent of yield is the capitalization rate (cap rate):
Cap Rate = Net Operating Income ÷ Current Property Value × 100
The NCREIF Property Index reported an unleveraged four-quarter return of 4.31% through Q2 2025, with income comprising 1.19% of that figure — illustrating how modest income yield can be even in institutional-quality real estate.
Private direct participation investments work differently. Unlike institutional real estate, yield in oil and gas development is shaped by three interlocking inputs:
- Production revenue from the underlying wells
- Operating expenses and depletion over the asset's life
- Tax deductions that shift effective after-tax return
PetroVybe, a Texas-based natural gas development company offering direct participation to accredited investors, applies this in practice. Partners applied Intangible Drilling Cost (IDC) deductions at 94% of invested capital against active income in 2025 — pushing the effective after-tax yield substantially above what gross production revenue alone would suggest.
Yield vs. Return: Why the Distinction Matters
Yield and total return are related but not interchangeable. Confusing them leads directly to poor asset selection.
Yield measures only the income component — dividends, coupons, rent, production distributions.
Total return adds or subtracts capital appreciation or depreciation from that income figure.
When Yield Misleads
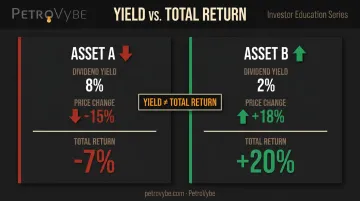
Consider two assets:
- Asset A: 8% dividend yield, but the underlying company is deteriorating and the stock price has fallen 15% over 12 months. Total return: -7%
- Asset B: 2% dividend yield from a growth company, but share price has appreciated 18%. Total return: +20%
A high yield number can mask a deteriorating asset. Income-focused investors who ignore capital erosion often discover — too late — that their "high-yield" position has destroyed net wealth.
When Total Return Metrics Are More Informative
For long-horizon investments, yield alone rarely tells the full story. That's where MOIC (Multiple on Invested Capital) and IRR (Internal Rate of Return) become the more useful benchmarks:
- MOIC captures total realized value divided by invested capital, measuring the overall magnitude of return without time-weighting
- IRR incorporates cash flow timing, making it the preferred metric when distributions are spread across multiple years
PetroVybe structures its investor reporting around both metrics for this reason. The company targets a 10-year MOIC range of approximately 2.2x to 5.8x and an IRR of approximately 26% for accredited investor partners — figures that capture the full return profile of a development-stage energy asset, not just a single year's income yield.
Factors That Influence Asset Yield in Practice
Interest Rate Environment
The Federal Reserve's target funds rate — held at 3.50%–3.75% as of June 2026 — sets the floor against which all other yields are benchmarked. When benchmark rates rise, new fixed-income yields increase and existing bond prices fall (raising their current yield). This dynamic ripples across every asset class as investors reprice required returns.
The ICE BofA U.S. High Yield Index effective yield stood at 6.96% as of July 15, 2026 — while investment-grade BBB bonds yielded 5.50% — illustrating how credit risk translates into yield premium in practice.
Asset Quality and Credit Risk
Lower-quality assets must offer higher yields to attract buyers. That premium exists because the market is pricing in:
- Higher probability of default or income disruption
- Greater price volatility
- Less predictable cash flows
Sustainable yield comes from assets with proven production, diversified income streams, or strong collateral backing. Credit quality shapes yield just as much as headline rate — and tax treatment shapes it further.
Tax Treatment as a Yield Multiplier
Tax obligations can reduce retained yield substantially. Conversely, tax-advantaged structures can improve effective after-tax yield well beyond what headline numbers suggest.
Oil and gas direct participation investments structured as limited partnerships pass IDC deductions through to investor-partners via K-1 forms. Three features make this structure distinct:
- IDC deductions apply against active income — not just passive income
- Eligible income includes W-2 earnings and capital gains
- Unlike real estate depreciation, there is no passive income restriction
For high-income earners, this distinction makes the effective after-tax yield materially different from the gross revenue figure.
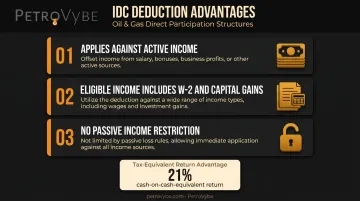
PetroVybe models that the IDC tax benefit alone delivers a 21% cash-on-cash-equivalent return before any production income is counted — a yield component that a raw headline percentage would never surface.
Common Misinterpretations of Asset Yield
Treating Yield as a Proxy for Total Performance
High-yield assets often carry high risk — that's why the yield is elevated. Distressed bonds, dividend stocks from companies with declining fundamentals, and speculative assets may produce income in the short term while destroying principal. The SEC notes explicitly that high-yield corporate bonds carry higher default risk, including missed interest and loss of principal. Income gains don't prevent a negative total return when capital loss is large enough.
Comparing Yield Figures Across Asset Classes Without Adjustment
A 6% bond yield, 6% dividend yield, and 6% cap rate are not equivalent:
- Bond YTM discounts all future cash flows to the present
- Dividend yield uses only the current annual dividend and share price
- Cap rate uses net operating income against property value — before financing costs
Each uses different inputs, different time horizons, and different tax treatment. Side-by-side comparisons without adjustment will mislead allocation decisions — the numbers look equivalent, but they're measuring fundamentally different things.
Using Yield as a Static Snapshot
Yield is dynamic — and that's the part many investors underestimate. A figure from 12 months ago may not reflect the current income-generating profile of an asset. If a company cuts its dividend, a bond is called early, or property vacancies rise, the yield changes fast.
Anchoring to a historical yield without monitoring its components means you may already be holding an asset whose real income has quietly eroded.
Frequently Asked Questions
What is asset yield?
Asset yield is the income an investment generates relative to its cost or current market value, expressed as a percentage. It measures how efficiently deployed capital produces income — but does not capture capital appreciation or depreciation, making it an incomplete performance measure on its own.
How do you calculate asset yield?
The base formula is: Net Income ÷ Asset Cost or Value × 100. Inputs vary by asset class — dividends for equities, coupon payments for bonds, net operating income for real estate, and interest income for lending assets.
What is the average return on a $500,000 investment?
It depends on asset class and structure. The S&P 500's historical annualized return of roughly 10% would yield approximately $50,000 per year on $500,000 — but that's a long-run average, not a guarantee. BBB corporate bonds currently yield around 5.50%, real estate closer to 4-5% unleveraged. After-tax returns differ significantly from any of these headline figures.
What is the difference between yield and return on an asset?
Yield captures only the income component — dividends, interest, rent, or production distributions. Total return includes both income and any change in the asset's market value. Total return is the more complete performance measure; yield is more relevant for income-focused investors prioritizing cash flow over capital appreciation.
Is a higher yield always better?
No. Higher yield typically reflects higher risk. Distressed bonds and deteriorating dividend stocks often carry elevated yields precisely because the market is pricing in credit, default, or capital loss risk. A yield that looks attractive on paper can signal an asset in decline — income sustainability matters as much as the headline rate.
How does tax treatment affect effective asset yield?
Tax obligations can significantly reduce what an investor actually retains from a given yield. Certain structures — such as oil and gas direct participation programs that allow IDC deductions against active W-2 income and capital gains — can improve effective after-tax yield well beyond what the gross percentage suggests. How the deduction is structured determines how much after-tax value it delivers.