
That distinction is gross vs net investment, and confusing the two can lead to seriously misreading a business's or economy's real growth trajectory.
Key Takeaways
- Gross investment = total capital expenditure before any depreciation deductions
- Net investment = gross investment minus depreciation — the real measure of new productive capacity added
- Positive net investment signals growth; negative signals a shrinking capital base
- The gap between the two metrics is largest in capital-intensive sectors like oil and gas
- For investors, net investment is the sharper lens for evaluating whether capital is actually growing — or just replacing what's wearing out
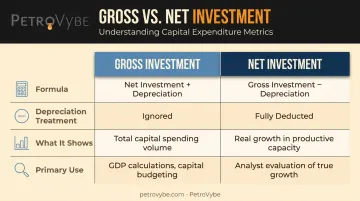
Gross vs Net Investment: Quick Comparison
| Metric | Gross Investment | Net Investment |
|---|---|---|
| Formula | Net Investment + Depreciation | Gross Investment − Depreciation |
| Depreciation Treatment | Ignored | Fully deducted |
| What It Shows | Total capital spending volume | Real growth in productive capacity |
| Primary Use | GDP calculations, capital budgeting | Analyst evaluation of true growth |
What Is Gross Investment?
Gross investment is the total expenditure on capital goods during a given period — covering new assets, improvements to existing assets, and replacement of worn-out equipment — with no deduction for depreciation.
Formula: Gross Investment = Net Investment + Depreciation
A simple example: if net investment is $500,000 and depreciation is $100,000, gross investment is $600,000. The full $600,000 is what appears in spending reports, regardless of how much of it simply replaced aging assets.
Why It Matters as an Economic Indicator
According to the Bureau of Economic Analysis, gross private domestic investment includes all fixed investment and inventory change, with no deduction for the consumption of fixed capital. It is the "I" in the standard GDP expenditure identity:
GDP = C + I + G + NX
Policymakers and economists use gross investment to gauge business confidence and the pace of capital deployment. When it rises, companies are actively committing to productive capacity — one of the earliest signals of economic expansion.
The most recent data reinforces that scale: U.S. gross private domestic investment reached $5,634 billion (seasonally adjusted annual rate) in Q1 2026, according to the Federal Reserve's FRED database. That figure is driven significantly by capital-intensive sectors, where replacement spending alone demands massive ongoing commitment.
Where Gross Investment Figures Are Largest
In capital-intensive industries — oil and gas, utilities, telecommunications, heavy manufacturing — gross investment figures are especially large because assets depreciate quickly and replacement spending is continuous. Global upstream oil and gas investment alone reached $570 billion in 2024, up 7% year-over-year according to the IEA.
In these sectors, gross investment sets the true baseline for capital commitment — before depreciation adjustments reduce the number to something more flattering but less complete.
What Is Net Investment?
Net investment is the real addition to productive capital stock after accounting for what depreciation consumed. It answers a direct question: after replacing what wore out, how much new productive capacity was actually created?
Formula: Net Investment = Gross Investment − Depreciation
Using the same numbers: $600,000 gross investment − $100,000 depreciation = $500,000 net investment. That $500,000 is what genuinely expanded the capital base.
Positive vs. Negative Net Investment
The sign of net investment matters enormously:
- Positive net investment — the capital stock is growing; the business or economy is expanding productive capacity
- Zero net investment — the capital base holds steady; every dollar spent replaces what depreciated, nothing more
- Negative net investment — depreciation exceeds new spending; the productive base is actively shrinking
Sustained negative net investment is one of the clearest warning signals in economic analysis. It often precedes declining output, reduced competitiveness, and lower long-term growth potential. At the macro level, economists track this signal through national income accounting — where the allocation of resources between consumption and investment determines how fast an economy grows.
Net Investment and National Income
In a simplified national income framework, aggregate income (Y) divides between consumption (C) and net investment (I):
Y = C + I
The allocation between these two determines an economy's long-term growth rate. Higher net investment — more resources directed toward building productive capacity rather than current consumption — compounds into greater future output. A 2025 Federal Reserve analysis found that differences in investment rates explain approximately 55% of the observed productivity gap between the U.S. and major European economies.

Why Analysts Prefer Net Investment
Net investment strips out replacement spending and reveals whether a company or economy is genuinely building value. Analysts track trends — rising, flat, or falling — over multiple periods to assess growth trajectory and capital discipline.
Industry context matters here. Capital-intensive sectors like oil and gas require continuous high net investment just to maintain output as wells deplete and equipment ages.
Service and technology businesses, with minimal physical assets, operate on far lower net investment requirements. Comparing the two without that adjustment produces misleading conclusions.
Gross vs Net Investment: Which Metric Matters More?
Neither metric is universally superior. The right one depends entirely on the question being asked.
- Use gross investment to assess total capital commitment, cash flow requirements, and the overall scale of economic or business activity
- Use net investment to evaluate whether a company or economy is genuinely growing, maintaining, or eroding its productive base
Three factors determine how wide the gap between the two metrics will be — and which one deserves more weight in a given analysis.
The Key Factors to Weigh
When deciding which metric to prioritize:
- Industry capital intensity — high-depreciation sectors widen the gap between gross and net
- Asset age — older asset bases carry higher depreciation, making net investment a smaller fraction of gross
- Time horizon — short-term capital planning often focuses on gross; long-term growth analysis centers on net
The Scenario That Catches Investors Off Guard
High gross investment with low or negative net investment means all that capital spending goes toward replacing worn-out assets — none of it adds productive capacity. The asset base isn't growing; it's just being maintained. Contrast that with a scenario where both are high — that combination signals genuine expansion.
The common investor mistake is evaluating growth purely by capital expenditure without asking how much of it covers depreciation. In capital-intensive businesses — pipelines, utilities, heavy manufacturing — the answer is often "most of it." That distinction determines whether you're looking at a business that's compounding or one that's treading water.
How These Metrics Apply in Capital-Intensive Investment Decisions
In upstream oil and gas specifically, the gap between gross and net investment is often substantial. Drilling equipment, wellbore infrastructure, and production assets depreciate through both physical wear and natural reservoir depletion. API's analysis shows that real U.S. oil and gas extraction investment fell from $255 billion in 2014 to $106 billion in 2024, while average fixed-asset age climbed to nearly 15 years — the highest in the dataset's history. That aging asset base is a concrete illustration of what happens when gross investment doesn't keep pace with depreciation.
How Tax Treatment Changes the Equation
For accredited investors in U.S. oil and gas direct participation programs, there's a structural mechanism that changes how gross investment translates into after-tax net cost: the Intangible Drilling Cost (IDC) deduction.
Under IRS rules, investors with a qualifying working interest may elect to deduct eligible IDCs as current business expenses in the year incurred. Qualifying costs include wages, fuel, drilling supplies, and contractor work — expenses without salvage value.
The practical effect:
- IDCs typically represent 60–80% of total invested capital in a new-drilling development program
- On a $100,000 gross investment, that means $60,000–$80,000 is deductible in year one against active income, including W-2 earnings and capital gains
- At a blended effective tax rate of approximately 30%, that deduction alone generates roughly $21,000 in tax savings — a 21% cash-equivalent return before any production revenue

This makes the gross investment figure especially relevant to analyze upfront: because the after-tax net cost can be substantially lower than the nominal capital committed.
A Real-World Reference Point
Those projected 60–80% IDC ranges represent the baseline — real programs can exceed them. PetroVybe, a Texas-based oil and natural gas development company, structures its investment programs around the IDC deduction. Partners who joined in 2024 received a 91% tax deduction against active income; 2025 partners achieved 94% — both above the standard 60–80% range, and both offsetting W-2 income and capital gains rather than being capped at passive income only.
For investors running MOIC projections, the after-tax net cost — not the nominal capital figure — is what determines actual returns. Getting that number right depends on understanding how gross investment, depreciation, and deduction timing interact.
Conclusion
Gross investment captures the full picture of capital spending. Net investment reveals the depreciation-adjusted addition to productive capacity. Neither tells the complete story alone.
Together, they answer two distinct but critical questions: how much capital is being deployed, and how much of that deployment is actually building something new. For any capital-intensive opportunity — from evaluating a company's balance sheet to assessing an oil and gas development partnership — understanding the relationship between these two figures, and the factors that drive the gap between them, is essential for distinguishing genuine capacity growth from capital that's simply running in place.
Frequently Asked Questions
How do you calculate gross investment and net investment?
Gross Investment = Net Investment + Depreciation. Net Investment = Gross Investment − Depreciation. Using a concrete example: with $600,000 gross investment and $100,000 depreciation, net investment equals $500,000 — the real addition to the capital stock.
What does gross investment mean?
Gross investment is the total capital expenditure on assets during a given period, with no deduction for depreciation. It reflects the full scale of capital spending — including both replacement of worn-out assets and genuinely new additions — in a business or economy.
Should you invest 20% of your gross or net income?
Standard financial planning guidelines — including the CFPB's 50/20/30 rule — apply the 20% savings allocation to net (take-home) income. High-income earners often structure contributions differently based on tax strategy, particularly when using tax-advantaged vehicles such as oil and gas direct participation programs.
What does a negative net investment indicate?
Negative net investment means depreciation exceeds gross investment, so the capital stock is contracting rather than growing. For investors, it signals underinvestment, deferred maintenance, or economic contraction — a red flag that warrants closer scrutiny of any business or sector's long-term viability.
Is gross investment always higher than net investment?
Yes, in practice. Gross investment includes both replacement spending and new additions, while net investment only captures the surplus above depreciation. Net investment would only equal gross investment if depreciation were zero — a practically impossible condition for any real productive asset.
How does net investment relate to GDP?
Net investment is a component of the national income equation Y = C + I, where higher net investment expands an economy's productive capital stock and drives long-term GDP growth. Consistent positive net investment is what separates expanding economies from stagnating ones.