
Introduction
America's wealth gap hasn't been this wide since the Gilded Age. The top 1% of U.S. households now hold roughly a third of the nation's total net worth, according to the latest Federal Reserve Distributional Financial Accounts data. The bottom half of the country splits just 2.5% between them.
You've probably felt the disconnect. The stock market hits new highs, GDP grows, and headlines call the economy strong. Yet your own net worth barely moves. Many people wonder why prosperity seems to flow upward instead of trickling down, and whether the system favors people who already have money.
It largely does, and the data backs that up. This article breaks down what wealth distribution means, where the numbers stand today, and why the gap keeps widening. It also covers who it hurts and what you can do about it, including practical moves you can make right now.
Key Takeaways
- Top 1% households hold 31.6% of U.S. wealth; bottom 50% hold just 2.5%.
- Wealth inequality runs far deeper than income inequality, and the gap has widened steadily since 1989.
- Asset ownership, tax structure, and inheritance drive most of the divide, not effort or wages.
- Individuals can already build wealth by owning appreciating assets, just like the top 1%.
What Is Wealth Distribution?
Wealth vs. Income Distribution
Wealth and income get used interchangeably, but they measure different things entirely.
- Income is what you earn in a year: wages, salary, dividends, business profits.
- Wealth is what you actually own after debts, including home equity, stocks, retirement accounts, and business equity, minus everything you owe.
A surgeon earning $400,000 a year with $500,000 in student debt has high income but modest wealth. A retiree with a paid-off house and a stock portfolio may have limited income but substantial wealth.
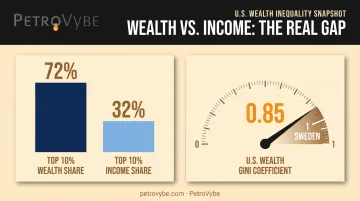
This distinction matters because wealth inequality is consistently worse than income inequality. In 2022, the top 10% of U.S. families held 72% of the nation's wealth, while the top 10% by income earned just 32% of total income, according to a 2022 Congressional Budget Office analysis. The OECD finds this pattern holds across nearly every developed country it studies.
How Economists Measure Wealth Distribution
Economists rely on two main tools:
- Percentile wealth shares – the percentage of total net worth held by a slice of the population, such as the top 1%, top 10%, or bottom 50%.
- The Gini coefficient – a single score from 0 (perfect equality) to 1 (one person owns everything).
The U.S. wealth Gini coefficient sits around 0.85, placing it among the most unequal wealth distributions of any developed economy, with only Sweden ranking higher among OECD nations with comparable data, despite Sweden's generous social programs. It's a reminder that wealth concentration and income support aren't the same fight.
Wealth Distribution in America Today: The Numbers
The abstract numbers above get uncomfortable fast once you zoom into specific figures. Here's what current Federal Reserve and global wealth data show about who owns what in America.
The top 1% of U.S. households hold about 31.6% of all household wealth. The bottom 50%, roughly 65 million households, hold just 2.5%. Put another way: the average household in the top 1% owns hundreds of times more than the average household in the bottom half.
The 36-Year Shift: 1989 to 2025
Wealth concentration didn't happen overnight. Federal Reserve data tracking household wealth since 1989 shows a steady climb toward the top:
- The top 0.1% of households saw their share of national wealth climb toward 14.5% today, up substantially from the late 1980s.
- The "upper-middle" group, households between the 50th and 90th percentiles, saw its share fall from around 36% in 1989 to about 29.3% today.
- Nearly every group below the top 1% has lost ground over that stretch, even households that own homes and hold retirement accounts.
The takeaway: middle-class Americans didn't stop saving. The assets driving wealth growth at the top, mainly stocks and business equity, simply outpaced everything else.
How Many Americans Are Actually Millionaires?
Despite headlines suggesting millionaires are common, most Americans are nowhere close. According to Credit Suisse's Global Wealth Databook, roughly 9.7% of U.S. adults hold net worth above $1 million.
At the other end of the spectrum, nearly 23% of U.S. adults have a net worth below $10,000, about the price of a used car.
The Racial and Gender Wealth Divide
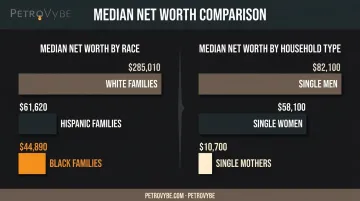
Wealth gaps also cut sharply along racial and gender lines. Federal Reserve survey data for 2022 shows stark differences in median family net worth:
| Group | Median Net Worth (2022) |
|---|---|
| White families | $285,010 |
| Hispanic families | $61,620 |
| Black families | $44,890 |
That's close to a six-to-one gap between white and Black median household wealth.
Gender gaps persist too. Median net worth for single men sits around $82,100, compared to $58,100 for single women. Single women without children actually hold wealth nearly on par with single men, while single mothers hold a fraction of either, just $10,700. Motherhood carries a real financial cost that fatherhood often doesn't.
What Causes Unequal Wealth Distribution?
Asset Ownership and Market Compounding
The top 1% didn't get rich from salaries. They got rich by owning things that compound.
- In 2018, the top 1% held 50% of all corporate equity and 53% of noncorporate business equity, both up sharply from 1989.
- Middle-class wealth sits mostly in home equity. In 2022, homeowners held a median of just $201,000 in housing value.
Stocks and business equity have compounded far faster than home values for decades. Own the right asset class and time does the heavy lifting; own the wrong one and you're treading water.
Technology and Globalization
Automation rewards workers who can build, manage, or invest in it, typically highly educated, asset-owning professionals. Globalization simultaneously expanded the global labor pool competing for the same jobs, suppressing wage growth for everyone else.
A software engineer who owns equity in the platform he builds captures its upside; the worker it displaces captures none of it. Capital income accelerates while wage income stalls.
Tax Policy and Structural Advantages
The U.S. tax code taxes capital gains more favorably than wages, and pandemic-era relief made that bias explicit. A CARES Act provision loosening business-loss deduction limits sent 82% of its $170 billion benefit to people earning over $1 million a year, according to the Institute on Taxation and Economic Policy.
Wage earners saw almost none of that relief. They also pay payroll taxes on every dollar of income, while investment gains face no such levy, widening the gap year after year.
Inherited Wealth and Generational Head Starts
Fortunes rarely start from scratch. Institute for Policy Studies research found that more than 60% of Forbes 400 members grew up with substantial privilege, whether inherited wealth, family businesses, or elite education that gave them a running start.
Even without deliberate advantage-seeking, economists describe a phenomenon called wealth condensation: compounding returns alone concentrate wealth over time, the same way a snowball grows faster the bigger it gets.
The Real-World Effects of Wealth Inequality
Wealth concentration reshapes daily life for millions of people in concrete, measurable ways.
- Reduced economic mobility: Children born into low-wealth households face fewer pathways to college, homeownership, or starting a business. Wealth, not just income, determines who can take entrepreneurial risks or absorb a bad year.
- Outsized political influence: In the 2024 election cycle, 100 billionaire families contributed $2.6 billion to federal races, one of every six dollars spent, per Americans for Tax Fairness. Policy tends to follow the money.
- Financial fragility: Roughly 10% of U.S. households had zero or negative net worth in 2022, per Census Bureau data. One emergency expense could push these families into debt.
- Worse mental health outcomes: A 2018 systematic review of 26 studies found that populations with higher income inequality face a 19% greater risk of depression, concentrated among unemployed and lower-income individuals.
Solutions to Wealth Inequality: The Policy Debate
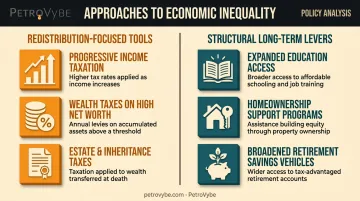
Policymakers have debated wealth inequality for decades without landing on consensus. The tools on the table generally fall into two camps.
Redistribution-focused tools:
- Progressive income taxation that raises rates on higher earners
- Wealth taxes on net worth above a set threshold
- Estate and inheritance taxes aimed at breaking up generational fortunes
Structural, long-term levers:
- Expanding access to higher education and job training
- Making homeownership more attainable through down-payment support
- Broadening retirement savings vehicles like employer-matched 401(k)s
Both camps carry trade-offs. The IMF generally favors strengthening capital-gains taxation and closing loopholes over introducing a recurring wealth tax, citing valuation and enforcement headaches.
The OECD finds that well-designed inheritance taxes can reduce concentration and improve equality of opportunity. Poorly designed versions, though, can discourage saving or get avoided entirely by anyone with a good accountant.
There's no single fix here. Some economists argue aggressive redistribution slows investment and growth. Others argue unchecked concentration eventually destabilizes economies and frays social cohesion.
That debate won't resolve soon. Investors aren't waiting: tax-advantaged tools like PetroVybe's oil and gas partnerships let accredited investors build assets and manage tax exposure now.
Individual Solutions: Building Wealth When the System Favors Asset Owners
Waiting for tax reform isn't a wealth strategy. It's a bet on a legislative process that moves slowly, if it moves at all.
Here's what the data above actually teaches: the top 1% didn't get wealthy through wages. They got wealthy by owning appreciating assets, stocks, real estate, business equity, and letting compounding do the work. That playbook isn't secret. It's just been harder for everyday earners to access at scale.
The Tax Code Already Rewards Asset Owners
The current tax code already favors capital over wages, and accredited investors can access structures historically reserved for institutions and insiders. Direct participation in resource development is one example most people never hear about.
This is where PetroVybe fits in. PetroVybe is a private Texas natural gas development company giving accredited investors direct, early-stage access to Natural Gas Liquids development in Lavaca County and the broader Gulf Coast Basin. Investors own the asset directly, not shares in a stock or fund.
Key features of the structure:
- Substantial first-year tax deductions: Intangible Drilling Cost deductions apply against active income, including W2 wages and capital gains, unlike most real estate deductions limited to passive income.
- Strong deduction track record: PetroVybe targets around 70% in year one; 2024 and 2025 partner classes internally reported 91% and 94% deductions, respectively.
- Targeted 10-year MOIC: approximately 2.2x to 5.8x, with a projected IRR near 26% based on conservative-case financial modeling.
- Minimum investment: $100,000, restricted to verified accredited investors under SEC Regulation D 506(c).

Diversification Beyond the Stock Market
Most of the top 1%'s recent wealth gains have ridden the stock market's momentum. That's a concentration risk of its own. Tangible assets like natural gas development are largely uncorrelated to equity market swings. That's the same logic that pushes family offices toward real assets, offering a hedge against both volatility and inflation.
None of this requires waiting for Congress to act. The wealth-building playbook the top 1% has used for decades, asset ownership, favorable tax treatment, and long time horizons, depends more on access than exclusivity. That access is now within reach for accredited investors willing to look beyond traditional assets.
Frequently Asked Questions
What is the meaning of wealth distribution?
Wealth distribution describes how a society's total net worth, meaning assets minus liabilities, is divided among its population. It differs from income distribution, which only measures annual earnings.
What percentage of wealth does the top 10% control?
The top 10% of U.S. households control roughly 72% of total household wealth, according to Congressional Budget Office data. That share has grown steadily since the late 1980s.
What percentage of Americans have a net worth of $1,000,000?
Roughly 9.7% of U.S. adults hold net worth above $1 million, according to Credit Suisse's Global Wealth Databook. Nearly a quarter of adults hold less than $10,000.
What is the difference between wealth inequality and income inequality?
Income is what you earn annually; wealth is what you've accumulated after debts. Wealth inequality is consistently more extreme than income inequality in nearly every developed country.
What causes wealth inequality to keep growing?
Compounding returns on stocks and business equity, tax policy favoring capital gains over wages, and inherited wealth passed between generations all keep widening the gap.
How can everyday investors build wealth despite rising inequality?
Focus on owning appreciating assets rather than relying on wages alone, use tax-advantaged investment structures, and diversify into alternative assets like real estate or resource development.