
Equity analysts, M&A professionals, and a growing number of accredited investors evaluating private development deals all rely on it daily. Getting it wrong carries real consequences given how volatile commodity prices swing and how capital-intensive drilling programs are.
Terms like EBITDAX, NAV, and EV/2P get thrown around constantly in the industry, yet they remain poorly understood outside technical circles. This article breaks down the three core valuation approaches, the multiples unique to oil and gas, and how the numbers shift depending on whether you're looking at an upstream, midstream, or downstream business.
Key Takeaways
- Analysts triangulate value using three frameworks: Income, Market, and Asset approaches.
- EV/EBITDAX and EV/2P account for reserve depletion that standard metrics ignore.
- Valuation methods differ dramatically across Upstream, Midstream, and Downstream segments.
- Reserve classification (1P, 2P, 3P) and engineering reports anchor upstream valuations.
- No single method stands alone; credible valuations blend multiple approaches.
Why Oil and Gas Valuation Differs From Other Industries
Most industries treat their revenue-generating base as ongoing. A retailer doesn't wake up one day to find its store inventory has physically shrunk. An E&P company does, every single day production flows.
Reserves are a depleting asset. Southwestern Energy's SEC filings describe reserve replacement as the measure of success in adding new reserves that offset current production. That distinction means valuation must account for a shrinking asset base rather than a static one.
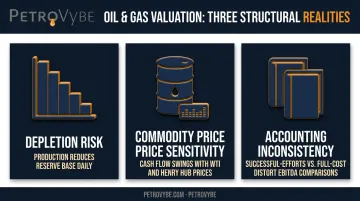
Three structural differences set oil and gas apart:
- Depletion risk: production today reduces tomorrow's reserve base, so growth requires constant reinvestment just to stand still.
- Commodity price sensitivity: cash flow swings with WTI and Henry Hub prices far more than in traditional industries, forcing analysts to model wide valuation ranges instead of single-point estimates.
- Accounting inconsistency: companies using successful-efforts accounting expense unsuccessful exploration costs immediately, while full-cost accounting pools those costs into a larger cost center, distorting EBITDA comparisons unless normalized.
Why the Industry Invented EBITDAX
This last point matters more than most investors realize. Two E&P companies with identical operations can report wildly different EBITDA figures purely based on which accounting method they chose.
That's exactly why the industry created EBITDAX: adding back exploration expense strips out the accounting choice, letting analysts compare companies on equal footing regardless of successful-efforts or full-cost reporting.
The Three Core Valuation Approaches Used in Oil and Gas
Virtually every oil and gas valuation converges from three directions: Income, Market, and Asset. Analysts rarely rely on just one. Instead, they build a defensible range by cross-checking outputs from each method against the others.
The Income Approach (DCF and NAV Modeling)
The traditional Discounted Cash Flow (DCF) method estimates the present value of future free cash flow, typically including a terminal value that assumes the business continues indefinitely. For pure-play E&P companies, that assumption breaks down. Reserves run out. There's no perpetual cash flow to discount.
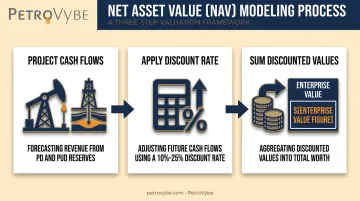
That's why the industry substitutes a Net Asset Value (NAV) model instead. NAV modeling has no terminal value because it only projects cash flow for the life of known reserves. The typical flow works like this:
- Project cash flows separately for Proved Developed (PD) producing reserves and Proved Undeveloped (PUD) reserves.
- Apply a benchmark discount rate, commonly ranging from 10% to 25%, depending on asset risk and commodity exposure.
- Sum the discounted values of both reserve categories to arrive at enterprise value.
Reserve reports themselves function as pre-tax DCF models. They incorporate production forecasts, future prices, operating costs, and development capital, all packaged into a single present-value figure analysts can lean on.
The Market Approach (Comparable Companies and Precedent Transactions)
This approach applies multiples pulled from similar publicly traded companies or recent M&A deals to the subject company's own metrics, things like EBITDAX, daily production, or reserve volume.
Screening criteria in oil and gas look nothing like a generic revenue-size comparison. Analysts instead filter peer companies by:
- Reserve life (R/P ratio): how many years of production remain at current rates
- Oil-versus-gas mix: pricing dynamics differ sharply between the two commodities
- Basin and geography: a Permian operator and an Appalachian gas producer rarely trade on comparable multiples
- PUD-to-total-proved ratio: signals how much future development risk sits on the balance sheet
Get the peer group wrong, and the resulting multiple tells you almost nothing useful about the target company.
The Asset Approach (Net Fair Market Value)
The Asset Approach values a company's tangible holdings, primarily its proved reserves, less any liabilities. It's anchored almost entirely to an independent reserve engineering report rather than market sentiment or comparable trading multiples.
Independent, third-party-validated reserve valuations have become the industry standard for establishing credible asset value. Operator self-reported figures invite obvious conflicts of interest, which is exactly why third-party engineering sign-off carries so much weight with investors.
This is a practice PetroVybe follows directly. The company's Lavaca County, Texas assets carry a $48MM PV-09 proved reserves valuation, determined by a licensed third-party engineering firm rather than calculated in-house.
PV-09 applies a 9% discount rate to future net revenue from proved reserves, similar in structure to the SEC's PV-10 convention but specific to this report. That distinction matters for investors comparing figures across different offerings, since discount rate conventions aren't always identical.
Key Oil and Gas Valuation Metrics and Multiples
Standard corporate multiples like P/E and EV/EBITDA don't capture what makes energy assets tick: depleting reserves, reserve replacement needs, and commodity exposure. The industry built its own toolkit instead.
| Metric | What It Measures | Why It Matters |
|---|---|---|
| EV/EBITDAX | Enterprise value over EBITDA plus exploration expense | Normalizes successful-efforts vs. full-cost accounting differences |
| EV/BOE/D | Enterprise value over daily production | Prices "flowing barrels" but ignores undeveloped potential |
| EV/2P | Enterprise value over proved-plus-probable reserves | Captures upside beyond just proved reserves |
| P/CF | Price over cash flow per share | Harder to manipulate than earnings, but ignores leverage differences |
| EV/DACF | Enterprise value over debt-adjusted cash flow | Preferred over P/CF when comparing companies with different capital structures |
EV/EBITDAX adds back exploration expense to EBITDA specifically because successful-efforts companies expense failed exploration costs immediately, while full-cost companies bury those costs in depreciation and depletion. Without that adjustment, you're comparing apples to oranges.
Reserve classification drives the EV/2P calculation, and not all reserve categories carry equal certainty:
- 1P (Proved) : at least 90% probability the reserves will be recovered
- 2P (Proved + Probable) : at least 50% probability
- 3P (Proved + Probable + Possible) : at least 10% probability
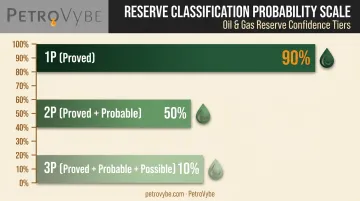
These probabilistic thresholds come directly from the Society of Petroleum Engineers' Petroleum Resources Management System, the framework most reserve engineers use worldwide.
On actual pricing, Houlihan Lokey's Q2 2025 upstream market update reported a median EV/LTM EBITDA of 5.5x and median EV/2025E EBITDA of 5.4x among public E&P companies. Those figures reflect EBITDA, not EBITDAX, so treat them as a directional benchmark rather than an exact EBITDAX comparison.
How Valuation Shifts Across Upstream, Midstream, and Downstream
The same company-wide term "oil and gas valuation" masks three genuinely different disciplines depending on where in the value chain you're looking.
Upstream (E&P) valuation centers on reserves, production decline curves, and direct commodity price exposure. NAV modeling and EV/EBITDAX dominate here because production is finite and cash flow tracks oil and gas prices almost one-for-one.
Midstream companies get valued more like utilities. Pipelines and processing assets generate contracted, fee-based cash flow, so analysts lean on DCF and EBITDA multiples.
Because many midstream businesses historically operated as MLPs, Distributable Cash Flow and Distribution Yield carry outsized weight, calculated as adjusted EBITDA less maintenance capital expenditure and interest expense.
Downstream (refining) valuation abandons reserves entirely. Refining margins, commonly measured through crack spreads such as the 3:2:1 spread, drive the economics instead.
The U.S. Energy Information Administration defines the 3:2:1 crack spread as the value of two barrels of gasoline plus one barrel of distillate, minus the cost of three barrels of crude. Standard DCF and TEV/EBITDA or P/E multiples handle the rest.
Integrated majors and royalty companies rarely fit neatly into one bucket. These typically require a Sum-of-the-Parts approach, valuing oil and gas properties, hedges, midstream assets, and leasehold acreage separately before combining them into a single enterprise value.
| Segment | Primary Valuation Approach | Key Metrics |
|---|---|---|
| Upstream (E&P) | NAV modeling, EV/EBITDAX | Reserves, decline curves, commodity exposure |
| Midstream | DCF, EBITDA multiples | Distributable Cash Flow, Distribution Yield |
| Downstream (refining) | DCF, TEV/EBITDA, P/E | Crack spreads (e.g., 3:2:1) |
| Integrated/royalty | Sum-of-the-Parts | Segment values combined into enterprise value |
Segment differences show up clearly in real transaction pricing too. Permian Basin acquisition pricing per flowing barrel of oil equivalent climbed from roughly $40,000 in 2020 to $48,000 in 2023, according to S&P Global.
Buyers cited inventory quality, Tier 1 acreage location, and contiguous-acreage synergies as the driving factors, all upstream-specific considerations that wouldn't apply to a midstream or refining deal.
Key Factors and Common Mistakes in Oil and Gas Valuation
Small assumption changes swing upstream valuations dramatically. Before trusting any number, check what's driving it underneath.
Inputs that move the needle most:
- Commodity price deck assumptions used for future production
- Decline rate estimates applied to existing wells
- Whether PUD (proved undeveloped) reserves get included in cash flow projections at all
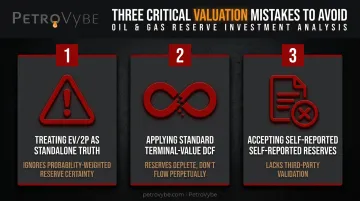
Three mistakes show up repeatedly:
- Treating EV/2P or EV/3P as standalone truth. Reserve categories don't carry equal certainty or cash flow timing. A 2P multiple that ignores the probability-weighted difference between proved and probable barrels overstates confidence.
- Applying a standard terminal-value DCF to E&P companies. Reserves deplete. NAV modeling, without a terminal value, is the industry-appropriate substitute, not an optional alternative.
- Accepting operator self-reported reserve figures at face value. This one matters most for private, non-traded development projects.
For accredited investors evaluating private deals specifically, the question to ask is simple: was the reserve valuation independently reviewed by a licensed third-party engineering firm, or just self-reported by the operator?
That distinction is exactly why independent validation matters. PetroVybe's reserve report portfolio spans three separate engineering firms across the Haynesville/Middle Bossier, Wilcox Development, and PetroVybe One LP YE2025 assessments, covering 264 development locations.
The company's clean 2025 audit opinion from Weaver, an entirely separate auditor from the engineering firms, adds a second layer of independent verification on top of the reserve figures themselves.
Frequently Asked Questions
What is the most common method used to value an oil and gas company?
Most valuations blend the Market Approach, using multiples like EV/EBITDAX, with the Income Approach through NAV or DCF modeling. Relying on a single method rarely produces a defensible number.
What is EBITDAX and why is it used instead of EBITDA?
EBITDAX adds exploration expenses back to EBITDA. This normalizes the gap between successful-efforts and full-cost accounting methods, which otherwise make identical companies look financially different.
What is the difference between 1P, 2P, and 3P reserves?
1P (proved) reserves carry roughly 90% certainty of recovery. 2P (proved plus probable) drops to around 50%. 3P (adds possible reserves) falls to about 10% certainty.
How is a private oil and gas development project valued for investors?
Private developers typically commission independent reserve engineering reports, often labeled PV-9 or PV-10, to establish a third-party-validated asset value rather than relying on operator estimates alone. PetroVybe's own Lavaca County project, for instance, carries a $48 million PV-09 valuation from a licensed third-party engineering firm.
Why do oil and gas company valuations fluctuate so much with commodity prices?
Both revenue and capital spending decisions tie directly to oil and gas price assumptions. That linkage makes multiples swing far more than in less cyclical industries.
Can a standard DCF model be used to value an E&P company?
Not effectively. A traditional DCF with terminal value assumes perpetual cash flow, which doesn't fit a depleting reserve base. NAV modeling, without a terminal value, is the standard alternative.