Introduction
The world burns through roughly 104 million barrels of oil per day, according to the International Energy Agency, and that number keeps climbing even as electric vehicles multiply and climate policy tightens. Global oil consumption acts as a real-time signal of economic health, industrial output, and capital flow.
Many investors struggle to reconcile two competing narratives: the energy transition is accelerating, yet oil demand keeps setting records. Both are true at once.
This shift matters for anyone with money in energy, from institutional allocators to private investors evaluating upstream development deals. Below, we break down the latest global oil consumption statistics, the five trends reshaping demand, and what they signal for energy investing over the next decade.
Key Takeaways
- Global oil consumption sits near 104 million barrels per day, with no peak date in sight
- India, not China, is now the strongest engine of demand growth in Asia-Pacific
- Petrochemicals, jet fuel, and NGLs now outgrow traditional road-transport fuel demand
- The U.S. shale boom made America the world's top producer and a net petroleum exporter
- AI-driven electricity demand is turning natural gas into a growth story, not a legacy fuel
Key Global Oil Consumption Trends
Trend 1: Global Oil Demand Keeps Climbing Despite the Energy Transition
Global liquid-fuels consumption hit an estimated 104.0 million barrels per day (mb/d) in 2025, according to the EIA's Short-Term Energy Outlook. That's up from roughly 91.4 mb/d in 2020, meaning demand has recovered well past pre-pandemic levels and kept grinding higher.
Forecasters disagree sharply on where this goes next:
- IEA: Demand plateaus near 105.5 mb/d by 2030, driven by EV adoption and efficiency gains
- OPEC: No peak in sight through 2050, reaching 112.3 mb/d by 2030 and 122.9 mb/d by 2050
Why the gap? IEA weights transport substitution heavily. OPEC weights population growth and rising per-capita energy use in developing economies more heavily. Neither is wrong, exactly. They're modeling different assumptions about how fast emerging markets industrialize.
This uncertainty matters practically. Demand resilience, even at the low end of these forecasts, underpins continued capital investment in upstream oil and gas development. Nobody is modeling a demand cliff.
Trend 2: Asia-Pacific Is Now the Primary Driver of Consumption Growth
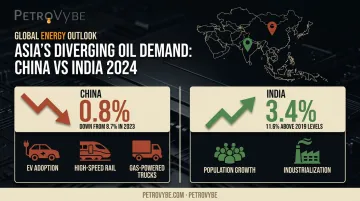
The geographic center of oil demand is shifting, and the shift happened faster than most analysts expected. According to IEA's Global Energy Review 2025, global oil demand grew just 0.8% (830 kb/d) in 2024. China's growth rate collapsed to that same 0.8%, down from 8.7% in 2023.
India told a different story. Its consumption grew 3.4% in 2024, well above the global average, putting Indian demand 11.6% above 2019 levels.
Three forces explain China's slowdown:
- Fading post-lockdown rebound effects
- Rapid EV and high-speed rail adoption
- Growing fleet of gas-powered trucks displacing diesel
India's rise reflects population growth, industrialization, and rising vehicle ownership that China largely worked through a decade ago. For global supply chains, this matters because refiners, shippers, and pricing benchmarks are recalibrating around Indian import patterns rather than assuming China remains the swing consumer.
Trend 3: Petrochemicals, Aviation, and NGLs Are Reshaping the Demand Mix
Gasoline demand is plateauing across developed economies as EVs eat into the vehicle fleet. But that doesn't mean total oil-linked demand is shrinking. It's migrating.
In 2024, petrochemical feedstock demand rose 900 kb/d, and jet fuel/kerosene demand climbed 320 kb/d, according to IEA data. Road transport growth, by contrast, slowed to roughly 0.3%.
| Demand Segment | 2024 Growth | Signal |
|---|---|---|
| Petrochemical feedstocks | +900 kb/d | Structural, not cyclical |
| Jet fuel/kerosene | +320 kb/d | Aviation still recovering post-COVID |
| Road transport | +0.3% | Near-flat, EV substitution taking hold |
| OECD demand (2024-2030) | -1.7 mb/d forecast | Mature-market contraction |
| Global NGL supply (to 2030) | +2.3 mb/d to 20.1 mb/d | Nearly half of total capacity growth |
The takeaway for producers: portfolios weighted toward petrochemical feedstocks, jet fuel, and NGLs are positioned on the growth side of this ledger. Portfolios weighted purely toward gasoline-bound crude are not.
Trend 4: The U.S. Has Flipped From Top Consumer to Top Producer and Exporter
Two decades ago, the U.S. imported the majority of its crude. Hydraulic fracturing changed that math entirely. Fractured wells produced just 102,000 barrels per day in 2000, less than 2% of U.S. output. By 2015, that figure hit 4.3 mb/d, roughly half of total production.
The result today: U.S. crude production reached a record 13.6 mb/d in 2025, up 3% year-over-year, with the Permian Basin alone adding 280 kb/d to reach 6.6 mb/d.
One nuance matters here: the U.S. is a net exporter of total petroleum (it has been since 2020) but remains a net importer of crude oil specifically. That export position comes from refined products, not raw crude.
This distinction reshapes global price-setting power. OPEC+ decisions still move markets, but U.S. shale now acts as a flexible supply buffer that dampens price spikes far faster than a decade ago.
Trend 5: Natural Gas Liquids Are Capturing a Growing Share of Hydrocarbon Demand
NGLs, meaning propane, butane, and ethane, have become the highest-margin corner of the hydrocarbon business. U.S. ethane production rose 7% to a record 2.8 mb/d in 2024, while domestic consumption climbed 9% to 2.2 mb/d.
Pricing tells the real story:
- NGL composite price: $7.28/MMBtu (January 2024)
- Henry Hub natural gas: $3.18/MMBtu (same month)
That's more than double the price for the liquid stream versus dry gas. Butane exports followed the same trajectory, hitting nearly 500 kb/d in 2024, up 12%.
This is exactly why development companies focused on NGL-rich gas assets are drawing investor attention.
PetroVybe, which operates natural gas development projects in Lavaca County and the broader Gulf Coast Basin, has built its acquisition and drilling strategy around this premium. The company targets liquids-weighted wells that command higher pricing at lower relative production cost than dry gas alone.
What's Driving These Global Oil Consumption Trends
A mix of economic, technological, and geopolitical forces sits behind these numbers.
Population and GDP growth in emerging markets. OPEC projects global population rising by 1.433 billion to 9.664 billion by 2050, almost entirely outside the OECD, with GDP per capita climbing from $21,500 to $37,100 (2021 PPP basis). More people, more income, more energy use, mostly outside mature markets.
Vehicle electrification. Global EV sales topped 17 million in 2024, up roughly 25% and representing more than one in five car sales worldwide. That displaced over 1.3 mb/d of oil demand in 2024 alone, a figure the IEA expects to reach 5.4 mb/d by 2030.
The AI boom's electricity appetite. Data centers consumed roughly 415 TWh globally in 2024 and are projected to approach 945 TWh by 2030. Utilities are turning to natural gas as the fastest-to-deploy, most dispatchable bridge fuel to meet that load.
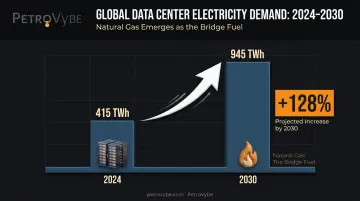
Wind, solar, and nuclear projects typically take years to permit and build, while gas plants can come online in a fraction of that time. PetroVybe's development strategy centers on this gap, growing natural gas production positioned to help meet the AI sector's fast-rising electricity demand.
OPEC+ supply policy. Eight OPEC+ members raised September 2025 output by 547 kb/d, retaining the option to reverse course. These decisions ripple through pricing and, indirectly, downstream consumption behavior.
Climate policy. Emissions regulations are nudging demand toward lower-carbon hydrocarbons like NGLs, reinforcing Trend 5 above.
How These Trends Are Impacting the Oil & Gas Industry
Shifting consumption patterns are forcing operators, investors, and workers to adapt in real time.
Operational Impact
Capital is moving away from pure oil plays toward NGL-rich, gas-weighted assets. Operators are prioritizing:
- Targeted workovers on existing wells to restore production without new drilling risk
- Optimization projects that extract more value from legacy assets
- Liquids-weighted new drilling, guided by updated geological and production data rather than outdated assumptions
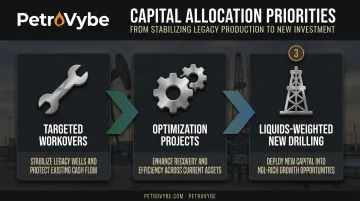
PetroVybe's own "Protect and Scale" framework reflects this exact pattern: stabilize legacy production first, then redeploy cash flow into new, oil- and NGL-weighted wells.
Business Impact
Private, tax-advantaged development vehicles are drawing rising investor interest as a way to gain direct exposure to demand growth, rather than buying already-mature public energy stocks or MLPs.
Structures offering Intangible Drilling Cost deductions are becoming a meaningful differentiator for high-income investors managing tax exposure. These deductions can run 60-80% of invested capital and apply against active income, not just passive income.
Workforce Impact
Demand is rising for two very different skill sets:
- Petroleum engineers who can model decline curves and optimize existing production
- Data and asset-intelligence professionals who translate production data into actionable decisions
This second category is new. Roles like "VP of Asset Intelligence and Performance" didn't exist a decade ago at development-stage companies. They exist now because compounding production requires the same analytical rigor as compounding capital.
Future Signals for Global Oil Consumption
Watch these indicators over the next one to three years:
- The IEA-OPEC peak-demand gap. If demand actually plateaus near 2030, capital allocation across the industry shifts meaningfully toward optimization over pure exploration.
- AI-driven gas demand. Some analysts project data center-driven power projects could add 6 to 10 Bcf/d of gas demand by 2030. This is a direct tailwind for gas developers positioned in production basins like the Gulf Coast, where companies such as PetroVybe are developing natural gas liquids assets to help meet it.
- LNG export capacity expansion. Projects already under construction are set to add roughly 345 bcm/year of global LNG capacity through 2030, while North American export capacity could more than double by 2029.
- Carbon capture adoption. Operational CCUS capacity exceeded 50 Mt CO2/year in early 2025, with the project pipeline potentially reaching 430 Mt/year by 2030.
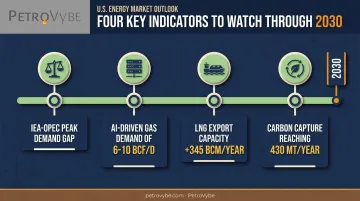
None of these are guaranteed outcomes. They're the leading edge of where consumption patterns are headed.
Conclusion
Global oil consumption is shifting on three fronts at once: geographically toward Asia, structurally toward petrochemicals and NGLs, and technologically toward AI-driven gas demand. None of these shifts is subtle, and none is finished playing out.
Investors and operators who recognize these currents early, rather than reacting after they're priced into public markets, are the ones positioned to capture long-term value. That requires discipline: third-party engineering validation, real production data, and a long time horizon rather than a quarterly one.
Strategic foresight backed by data and disciplined stewardship separates investors chasing last decade's energy trade from those positioning for the next one. PetroVybe applies that same discipline to its Gulf Coast Basin natural gas projects, pairing third-party reserve engineering with a 10-year horizon built for accredited investors ahead of the AI demand curve.
Frequently Asked Questions
What is the current global oil consumption rate?
Global oil consumption sits at roughly 104.0 million barrels per day (mb/d) in 2025, per EIA data, while the IEA's most recent forecast puts the figure closer to 103.9 mb/d. The small gap reflects differing definitions and forecast timing.
Which countries consume the most oil?
The United States leads at roughly 20 million barrels per day, followed by China at around 14.3 million, and India at approximately 5 million. Saudi Arabia and Russia round out the next tier at 3.7-4 million barrels per day each.
Is global oil demand expected to peak soon?
Forecasts diverge significantly. The IEA projects a plateau near 105.5 mb/d by 2030, while OPEC sees no peak through 2050, forecasting continued growth to nearly 123 mb/d.
How does natural gas fit into global oil consumption trends?
Natural gas and NGLs are gaining share as a cleaner, complementary hydrocarbon, particularly as AI-driven data centers push electricity demand higher. Natural gas already supplies close to half of U.S. grid power generation.
Why is Asia driving oil demand growth?
Population growth, industrialization, and rising vehicle ownership are the core drivers, particularly in India and, to a lesser degree, China. India alone grew consumption 3.4% in 2024, more than four times the global average.
How can investors gain exposure to global oil and gas demand growth?
Accredited investors can access early-stage natural gas and NGL development opportunities directly, rather than through public stocks or MLPs. PetroVybe, for example, offers partnership units combining upfront tax efficiency with long-term production-based returns.