Introduction
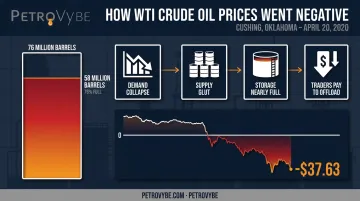
On April 20, 2020, something happened that had never occurred in the history of oil markets: WTI crude oil futures settled at -$37.63 per barrel, according to CME Group's official settlement data. Traders were paying buyers to take oil off their hands.
That single day captured the scale of a crisis few in the industry had modeled for. COVID-19 lockdowns gutted global demand for gasoline, jet fuel, and diesel at the exact moment an OPEC-Russia price war flooded the market with excess supply.
Two shocks, hitting at once.
This article breaks down how that collapse unfolded, which parts of the industry absorbed the worst damage, and how governments and companies responded. It also traces the structural changes that have reshaped oil and gas since.
We'll look at why natural gas held up better than crude, and what that means for investors today.
Key Takeaways
- COVID-19 and the OPEC+/Russia price war caused the steepest oil demand crash on record
- Oilfield services and shale drillers suffered the heaviest losses versus low-cost producers
- Upstream employment fell by over 118,000 jobs in eleven months, extending a downturn since 2014
- The pandemic sped up trends already underway: diversification, consolidation, and digitalization
- Natural gas demand held up far better than crude, a trend now reinforced by AI-driven electricity growth
The COVID-19 Shock: How the Pandemic Triggered a Historic Oil Price Collapse
Two forces collided in early 2020. Lockdowns and travel bans emptied roads and grounded flights, destroying demand almost overnight. At the same time, Saudi Arabia and Russia broke off production-cut talks and opened the taps, racing to defend market share instead of price.
The result was a demand shock the industry had no playbook for. The International Energy Agency's retrospective estimate puts 2020 global oil demand down 8.5 million barrels per day, an 8.8% decline year over year — the steepest annual drop on record. OPEC's own figures put the decline even higher, at 9.6 mb/d.
Why WTI Went Negative
The May 2020 WTI contract's expiration collided with a physical problem: nowhere left to put the oil. Cushing, Oklahoma, the delivery point for WTI futures, was running out of room.
- Cushing's working storage capacity stood at roughly 76 million barrels
- By mid-April, tank farms held about 58 million barrels, already at 76% of capacity
- Traders holding contracts near expiration faced a choice: arrange physical delivery to an already-full hub, or pay someone to take the barrels
That combination of low liquidity and vanishing storage space pushed the May contract to an intraday low of -$40.32 per barrel before settling at -$37.63. Brent crude, less tied to physical US storage, avoided going negative but still cratered: EIA recorded a 2020 daily low of just $9.12 per barrel, the weakest price in decades.
The OPEC+ Response
Facing collapsing revenues, OPEC and its partners (led by Russia) agreed to the largest coordinated supply cut in history:
| Period | Production Cut |
|---|---|
| May–June 2020 | 9.7 million bpd |
| July–December 2020 | 7.7 million bpd |
| January 2021–April 2022 | 5.8 million bpd |
The cut helped, but didn't reverse the damage overnight. Brent had recovered only to around $31/b by mid-April, well below pre-pandemic levels. Supply didn't fall below demand, allowing inventories to start drawing down, until June.
Sector-by-Sector Impact Across the Oil & Gas Value Chain
The pain wasn't evenly distributed. Some segments absorbed a direct hit; others had cushions built from years of lower-cost operations.
Drilling, Services, and Refining Took the Brunt
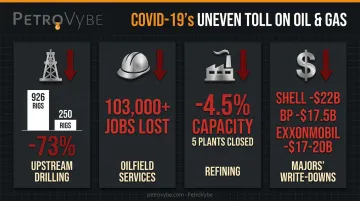
Upstream activity simply stopped. US rig counts fell from 926 in August 2019 to just 250 by August 2020, a collapse of nearly 73%. Canada saw a similar drop, from 142 rigs to 53.
Oilfield services companies, whose revenue depends entirely on drilling activity, had nowhere to hide:
- US oilfield services employment lost over 103,000 jobs between March and early September 2020
- Year-over-year losses in the segment topped 121,000 jobs
- Major service firms like Schlumberger and Halliburton announced tens of thousands of layoffs combined
Refiners fared little better. US refining capacity fell 4.5% to 18.1 million barrels per calendar day during 2020, as five major facilities, including Philadelphia Energy Solutions and Shell's Convent plant, shut down permanently. Margins compressed so severely that some West Coast refiners saw negative cracking margins by early April.
NOCs, IOCs, and the Jobs Toll
Low-cost national oil companies had more breathing room. Saudi Aramco posted a Q2 2020 production record of 12.1 million barrels per day and pressed ahead with plans to expand capacity to 13 million bpd.
International majors took a different path, writing down assets rather than expanding:
- Shell cut asset values by up to $22 billion
- BP wrote down up to $17.5 billion
- ExxonMobil later announced $17-20 billion in natural gas property write-downs
Upstream employment overall told the story plainly. Combined US oil and gas extraction and drilling-support employment fell from 434,339 jobs in January 2020 to 316,306 by December, according to Bureau of Labor Statistics data.
That's a loss of over 118,000 positions in less than a year, layered on top of a sector that had already shed 142,000 jobs during the 2014-2016 downturn.
Government Intervention and Industry Response Strategies
Relief efforts targeted both jobs and infrastructure. Canada moved fast, announcing C$1.72 billion in April 2020 for orphaned and inactive well cleanup:
- Up to C$1 billion allocated to Alberta
- C$400 million to Saskatchewan
- C$120 million to British Columbia
- C$200 million to Alberta's Orphan Well Association specifically
The program served two purposes at once: environmental remediation and preserving jobs for laid-off oilfield workers.
At the market level, the OPEC+ production cut agreement (detailed above) stabilized prices without fully reversing the collapse. Companies had to survive on their own terms:
- Slashed capital budgets, with most majors cutting planned spending by 20-30%
- Divested high-cost assets, selling or writing off shale and oil sands positions first
- Curtailed exploration as new frontier drilling paused almost entirely through 2020-2021
These moves weren't glamorous, but they kept balance sheets intact long enough for prices to recover.
Long-Term Structural Shifts: The Post-COVID Oil & Gas Landscape
COVID-19 didn't just cause a temporary crash. It accelerated shifts that were already brewing beneath the surface.
Consolidation became the defining trend. Weaker companies got absorbed rather than rebuilt independently:
- ConocoPhillips acquired Concho Resources for $9.7 billion in 2020, expecting $500 million in annual savings by 2022
- By 2023, announced upstream M&A spending reached $234 billion, with corporate deals, not just asset sales, making up 82% of that total
- Landmark 2023 transactions included ExxonMobil's $64.5 billion purchase of Pioneer and Chevron's $60 billion Hess acquisition
Majors also leaned harder into gas and diversified their portfolios:
- Shell set LNG expansion targets of up to 20 million tonnes per annum by 2030
- Shell completed its acquisition of Pavilion Energy in 2025, deepening its gas position
- Automation and digitalization spread across drilling and field operations to offset leaner headcounts
Production, meanwhile, surged past pre-pandemic highs. US crude and condensate output averaged 12.9 million barrels per day in 2023, surpassing the prior 2019 record of 12.3 million bpd, with December 2023 topping 13.3 million bpd.
The industry that emerged looked different, with fewer and larger players holding gas-heavier portfolios and a much sharper focus on capital discipline over growth-at-any-cost.
Investment Lessons: Why Natural Gas Emerged as a Resilient Opportunity Post-COVID
While crude oil demand fell 8.8% in 2020, global natural gas consumption dropped only about 1.9%, or roughly 75 billion cubic meters. Power generation and industrial use kept gas flowing even as gasoline demand evaporated. That gap wasn't a coincidence: it reflects a structurally different demand base.
For investors, the lesson was straightforward: concentrated exposure to crude oil price swings carries a correlation risk that natural gas assets don't share to the same degree. Diversifying into gas development wasn't just a hedge against oil volatility. It positioned investors ahead of a demand curve that's now accelerating.
That curve is AI. The IEA projects global data center electricity consumption to roughly double, from about 415 TWh in 2024 to 945 TWh by 2030. S&P Global estimates that growth alone could add 3-6 billion cubic feet per day of incremental US natural gas demand by 2030. Gas is now core infrastructure for the AI buildout, moving well beyond its old role as a transition fuel.
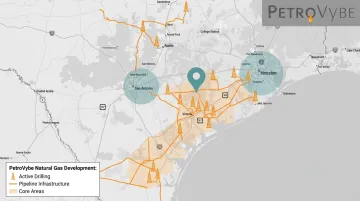
This is the environment PetroVybe was built for. As a private, Texas-based natural gas development company, PetroVybe gives accredited investors direct equity access to early-stage development assets in Lavaca County and the broader Gulf Coast Basin — the kind of positioning that was largely reserved for institutions before COVID reshaped the sector's capital structure.
A few specifics worth knowing:
- Partners received a 91% tax deduction against active income in 2024, rising to 94% in 2025, driven by Intangible Drilling Cost deductions that (unlike real estate depreciation) can offset W-2 income and capital gains directly
- Projects target a 10-year MOIC of roughly 2.2x-5.8x and an IRR near 26%
- The minimum investment is $100,000, limited to accredited investors under SEC Regulation D 506(c)
Third-Party Validation Backs the Numbers
In a sector this historically volatile, third-party validation matters. PetroVybe's proved reserves carry a $48 million PV-09 valuation from an independent, licensed engineering firm.
Chief Geophysicist Michael Stamatedes brings a 48-year career with a 75.2% well-location success rate, against an industry peer average below 40%. That's the kind of track record that separates disciplined development from speculative drilling, a distinction COVID-19 made painfully clear across the industry.
Frequently Asked Questions
How did COVID-19 affect oil and gas prices?
Pandemic lockdowns collapsed demand just as an OPEC-Russia price war flooded the market with supply. Storage ran out of room at Cushing, Oklahoma, pushing WTI futures to settle at -$37.63 per barrel on April 20, 2020.
Which segments of the oil and gas industry were hit hardest by COVID-19?
Oilfield services and US shale drillers suffered the most, as project cancellations and idle rigs drove utilization near zero. US rig counts fell from 926 to 250 within a year, and services firms lost over 100,000 jobs.
How many jobs were lost in the oil and gas industry due to COVID-19?
US upstream and specialist employment fell from 434,339 in January 2020 to 316,306 by December, a loss of roughly 118,000 jobs in under a year, on top of prior industry volatility.
Has the oil and gas industry fully recovered from COVID-19?
Production has more than recovered — US crude output hit a record 12.9 million barrels per day in 2023. Employment and rig counts, however, remain structurally lower than pre-pandemic levels due to efficiency gains and consolidation.
What long-term changes did COVID-19 bring to the oil and gas industry?
The crisis accelerated consolidation, with 2023 M&A activity hitting $234 billion. It also pushed majors toward gas and diversified portfolios while speeding up automation across drilling and field operations.
Is natural gas a resilient investment after the COVID-19 disruption?
Yes. Gas demand fell just 1.9% in 2020 versus oil's 8.8% drop, and that resilience is now reinforced by AI and data center electricity growth projected to double by 2030.