
The problem isn't fraud or bad accounting. It's that EBITDA and net income include non-cash adjustments and ignore how much money actually goes back out the door for capital spending. Two companies can report identical earnings and have wildly different cash positions.
This guide breaks down what cash flow conversion means, the formula behind it, a step-by-step worked example, benchmark ranges by industry, and practical ways to improve your own rate.
Key Takeaways
- Cash flow conversion shows how much EBITDA converts to free cash flow after capex
- The core formula: Free Cash Flow ÷ EBITDA × 100, drawn from both financial statements
- A healthy rate sits between 70% and 100%, though capital-heavy sectors run lower
- Tightening receivables and separating maintenance from growth capex are the fastest levers available
What Is Cash Flow Conversion?
Cash flow conversion is a liquidity and efficiency ratio. It measures how much of a company's reported earnings actually becomes cash available for reinvestment, debt repayment, or shareholder returns, rather than sitting trapped in receivables or getting swallowed by capital projects.
Here's the underlying issue it solves: EBITDA adds back depreciation and amortization and ignores capital expenditures entirely. Net income includes non-cash accruals too. That means a company's earnings can look strong on paper while its actual cash position tells a very different story.
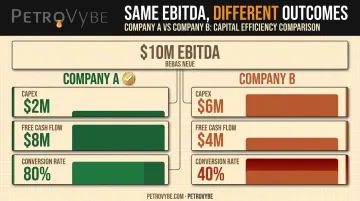
Consider two companies with identical $10 million EBITDA:
| Company A | Company B | |
|---|---|---|
| EBITDA | $10M | $10M |
| CapEx | $2M | $6M |
| Free Cash Flow | $8M | $4M |
| Conversion Rate | 80% | 40% |
Company A has twice the flexibility to pay down debt, fund a dividend, or reinvest in growth. Company B, despite matching earnings, is stretched thin. That difference is invisible if you only look at EBITDA.
FCF Conversion vs. Cash Conversion Ratio
These two metrics get confused constantly, but they test different things:
| Metric | Formula | What It Reveals |
|---|---|---|
| FCF Conversion | FCF ÷ EBITDA | Post-CapEx cash efficiency after accounting for capital spending |
| Cash Conversion Ratio | Operating Cash Flow ÷ Net Income | Whether accounting profit is backed by real operating cash |
Lenders rely on these metrics to gauge debt capacity, while investors use them to judge earnings quality before committing capital. Operators, meanwhile, apply the same numbers internally — a check on working capital discipline before problems compound.
Cash Flow Conversion Formula
The primary formula is straightforward:
Cash Flow Conversion (%) = (Free Cash Flow ÷ EBITDA) × 100
Breaking down each component:
Free Cash Flow = Cash from Operations − Capital Expenditures. Both figures live on the cash flow statement, under operating activities and investing activities respectively.
EBITDA = Operating Income (EBIT) + Depreciation & Amortization. EBIT comes from the income statement; D&A is typically disclosed on the cash flow statement or in the notes.
When to Use EBIT Instead of EBITDA
Some analysts swap EBITDA for EBIT in the denominator, especially in asset-heavy industries such as oil and gas development. This creates a stricter test since it doesn't add back depreciation on equipment that genuinely wears out and needs replacing.
It's a more conservative lens for capital-intensive businesses where D&A reflects real economic cost, not just an accounting convention.
The Net Income Alternative
A related version substitutes net income for EBITDA, producing what's known as the cash conversion ratio. This version is better suited for checking earnings quality broadly, since it captures interest and tax effects that EBITDA strips out.
Use FCF ÷ EBITDA when you care about capital reinvestment capacity; use OCF ÷ Net Income when you're testing whether reported profit is real.
How to Calculate Cash Flow Conversion: Step-by-Step Example
The calculation breaks into four steps: gather your inputs, find free cash flow, find EBITDA, then divide.
Step 1: Gather the Line Items
Build a simple table with the inputs you need:
| Line Item | Amount |
|---|---|
| Operating Cash Flow | $500M |
| Capital Expenditures | $20M |
| Operating Income (EBIT) | $450M |
| Depreciation & Amortization | $150M |
Step 2: Calculate Free Cash Flow
Free Cash Flow = Operating Cash Flow − CapEx $500M − $20M = $480M
Step 3: Calculate EBITDA
EBITDA = EBIT + D&A $450M + $150M = $600M
You could also verify this using the alternative bridge: Net Income + Interest + Taxes + D&A should land at the same figure.
Step 4: Divide and Convert to a Percentage
Conversion Rate = $480M ÷ $600M = 80%
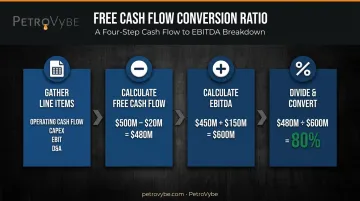
This result, drawn from CFI's worked example, signals a company converting most of its earnings into spendable cash. Capex and working capital drag are absorbing very little of that EBITDA.
Common Data-Sourcing Pitfalls
Watch for these mistakes when pulling real-world figures:
- Pulling CapEx from the wrong reporting period (quarterly vs. trailing twelve months)
- Mixing GAAP and non-GAAP EBITDA definitions across companies you're comparing
- Overlooking one-time gains or write-offs that inflate reported EBITDA without a matching cash impact
Because both FCF and EBITDA are non-GAAP measures, definitions vary company to company. Always reconcile the figures back to the cash flow statement before trusting a comparison.
What Is a Good Cash Flow Conversion Ratio?
Most finance teams treat a rate between 70% and 100% as healthy, though there's no universal rule carved into stone. Rates above 100% usually reflect favorable working capital timing, not a red flag, meaning the company collected cash faster than it recognized earnings that period.
Benchmarks vary sharply by capital intensity:
- Asset-light businesses (software, professional services) often run near or above 100%, since they spend little on physical capex
- Capital-heavy sectors (manufacturing, utilities, energy) typically run lower because ongoing reinvestment is unavoidable
Cash Flow Conversion in Capital-Intensive Industries Like Oil & Gas
Oil and gas development companies tend to post lower, more volatile conversion rates than asset-light peers. Heavy upfront drilling and development capex is the reason.
EIA data on 42 public exploration and production companies showed $27.5 billion in operating cash flow against $15 billion in capital spending in one quarter alone. Capex jumped 60% from the prior period as crude prices rose, and that kind of swing shows how quickly conversion can move when commodity prices and drilling budgets shift in opposite directions.
PetroVybe's growth strategy reflects the kind of capital discipline that strengthens long-term conversion in this environment. The company's approach splits capital into two lanes: protecting legacy production through targeted workovers on existing wells, and scaling through new drilling only when risk-adjusted returns justify it.
That structure builds a stable cash-flowing base before higher-risk capital gets deployed. It's exactly the discipline that keeps conversion from collapsing during a heavy development phase.
If you're evaluating a private oil and gas opportunity, don't stop at headline production or revenue growth. Ask the operator directly:
- How do they sequence capex between maintenance workovers and new drilling?
- What working capital practices affect the lag between production revenue and distributable cash?
- Do they hedge production to stabilize cash flow projections?
These questions reveal more about long-term investor outcomes than a single quarter's production numbers ever will.
How to Improve Cash Flow Conversion
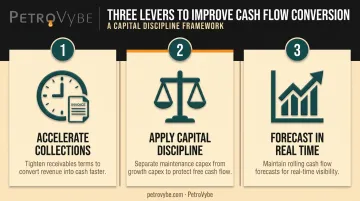
Three levers move the needle fastest:
Accelerate collections. Shrink the time between earning revenue and collecting cash. Tighten receivables terms, automate invoicing, and follow up on aging accounts before they become a drag on the ratio.
Apply capital discipline. Separate maintenance capex (protecting cash-generating assets) from growth capex (compounding future output), and prioritize the former before chasing speculative growth. McKinsey notes that deferring capital projects is one of the fastest ways to release cash, though it's a short-term lever, not a substitute for disciplined budgeting.
Forecast in real time. Use rolling cash flow forecasts to catch working capital drag early, before it erodes the conversion rate across several reporting periods. Waiting until quarter-end to notice a problem is usually too late to fix it that quarter.
Frequently Asked Questions
What is a good cash flow conversion ratio?
Most analysts consider 70% to 100% a healthy range, though acceptable levels vary by industry and capital intensity. Track the trend across several periods rather than judging a single quarter in isolation.
What does 100% FCF conversion mean?
A rate at or near 100% means nearly all EBITDA is converting into free cash flow. This signals minimal capex drag or working capital absorption during that period.
What's the difference between free cash flow conversion and the cash conversion ratio?
FCF ÷ EBITDA accounts for capital expenditures and tests post-investment cash efficiency. Operating Cash Flow ÷ Net Income skips capex and instead tests whether accounting profit is backed by real cash.
Can a cash flow conversion rate be negative?
Yes. Negative conversion happens when free cash flow itself turns negative, typically from heavy capital spending or operating losses, even while EBITDA stays positive.
How often should a company track its cash flow conversion rate?
Quarterly reviews catch short-term issues early. Pair those with trailing twelve-month or annual comparisons to smooth out seasonal swings and one-off timing effects.
Is a higher cash flow conversion rate always better?
Not necessarily. Unusually high or above-100% rates can signal underinvestment in growth capex rather than genuine efficiency. Read the number alongside the company's growth stage and reinvestment needs.