
Introduction
Every mature basin tells the same story eventually. Production climbs, peaks, then starts sliding down a decline curve that never really stops. Capital that once looked brilliant on paper starts quietly bleeding value while nobody's watching the right number.
That's the problem asset productivity turnaround exists to solve.
Many operators confuse two very different questions: is the asset running, and is the asset creating maximum value? A well can pump 24/7 and still be a drag on returns. That gap between utilization and productivity determines whether an operator merely survives a downturn or compounds wealth through one.
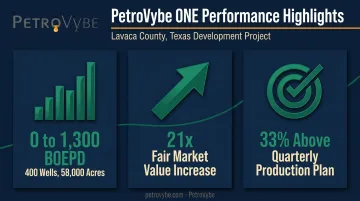
PetroVybe's own turnaround grew a stagnant South Texas asset to roughly 1,300 BOEPD across nearly 400 wells.
This guide breaks down what asset productivity actually means, how to calculate it, the levers that drive a real turnaround, and how it connects to the investor metrics that matter most: MOIC and IRR.
Key Takeaways
- Productivity ≠ utilization — low returns per dollar invested destroy value, even from producing wells
- Mature wells lose 10-50%+ of production annually across basin, vintage, and well type
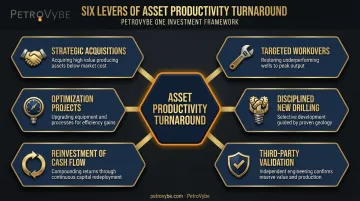
- Six levers drive turnarounds: acquisitions, workovers, optimization, drilling discipline, reinvestment, and third-party validation
- MOIC and IRR remain the ultimate scorecards for real value creation
What Is Asset Productivity?
Asset productivity measures the value or output an asset generates relative to the capital or resources invested in it. That's a different question than simply asking whether the asset is switched on.
Productivity vs. Utilization
Utilization asks: is the well producing? Productivity asks: is it producing enough, given what it cost to get there?
A well can run at full utilization, pumping barrels every single day, and still be a poor investment if the capital tied up in it could generate more value elsewhere. In oil and gas, this distinction plays out constantly across leaseholds:
- Production per well (BOEPD) measures raw output, not return
- Reserves realized versus estimated ultimate recovery (EUR) shows whether a well is hitting its geological potential
- Capital efficiency per producing well reveals whether spend is translating into proportional output
The Decline Curve Problem
Here's why this isn't a one-time fix. Tight-oil wells lose more than 50% of production in year one and roughly 30% in year two, according to SPE's Journal of Petroleum Technology.
Basin-specific year-five declines range from 16.7% in the Permian to 23.5% in the Eagle Ford. Conventional wells decline more gently, but the curve never flattens to zero.
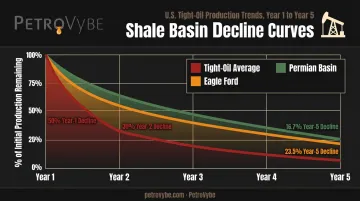
That's why asset productivity turnaround requires a deliberate, ongoing strategy rather than a single project. PetroVybe's own leadership has lived this firsthand, growing a portfolio from zero to approximately 1,300 BOEPD across roughly 400 wells and 58,000 acres.
That kind of growth doesn't happen by drilling and walking away. It happens by treating every well as a productivity problem to keep solving.
How to Calculate Asset Productivity
At its simplest, asset productivity follows one formula:
Asset Productivity = Output Generated ÷ Capital or Asset Base Employed
This mirrors the fixed asset turnover ratio used in traditional finance, where revenue is divided by average net fixed assets. Applied to oil and gas, it becomes:
BOEPD (or revenue) ÷ Capital deployed or proved reserves
A Practical Indicator: EBITDAX Growth Rate
For development-stage operators, tracking EBITDAX growth over time is one of the clearest signals that capital is being converted into value rather than just activity.
PetroVybe's leadership team has documented 4x year-over-year revenue growth and 5x EBITDA growth in past turnaround work, the kind of trajectory that separates an asset genuinely improving from one that's just staying busy.
Borrowing from Equipment Effectiveness
EBITDAX confirms the financial outcome, but a second framework helps diagnose where productivity gains actually originate on the asset itself. Manufacturing uses Overall Equipment Effectiveness (availability × performance × quality) to measure how much value a machine extracts from its potential.
Applied loosely to wells and facilities, the same logic holds: is the well available to produce, is it performing near its capable rate, and is the output quality (cut, pressure, gas composition) where it should be?
A longer-horizon version of this same idea shows up in Fair Market Value multiples. One project in PetroVybe's track record posted a 21x FMV increase, a signal that productivity gains compounded well beyond the initial capital outlay.
A Simple Example
The numbers below show how a single workover decision moves both sides of the productivity equation.
| Scenario | BOEPD | Capital Invested | Productivity Ratio |
|---|---|---|---|
| Before workover | 40 | $500,000 | 0.08 BOEPD per $1,000 |
| After workover | 58 | $560,000 | 0.104 BOEPD per $1,000 |
A $60,000 workover lifted output 45% while capital only grew 12%. That gap is the productivity gain — and it's exactly the kind of math a turnaround is chasing.
The Core Levers of an Asset Productivity Turnaround
Six levers consistently drive productivity improvements in upstream assets. None work in isolation.
Strategic Acquisitions: Buying undervalued or underperforming legacy assets at the right entry point creates immediate upside. PetroVybe's President and COO, Blaine Yeary, scaled a $5 billion asset from zero to 35,000 BOEPD over eight years, largely through off-market acquisition relationships most operators never see.
Targeted Workovers: Reworking existing wells is usually the fastest, most capital-efficient lever available. SPE describes well intervention as a route to restoring production faster than drilling, and one documented heavy-oil field case in Kern County produced a 27% average production increase with just 24-48 hours of downtime.
Optimization Projects: Artificial lift adjustments, facility debottlenecking, and downtime reduction squeeze more output from infrastructure that's already built and paid for. No new drilling capital is required.
Disciplined New Drilling: Prospect-picking accuracy determines whether new drilling adds value or just burns cash. PetroVybe's Chief Geophysicist, Michael Stamatedes, has posted a 75.2% well success rate across a 48-year career, a track record built well before modern geophysical tools existed for roughly half of it.
Reinvestment of Cash Flow: Funneling free cash flow back into the highest-return projects, rather than distributing every dollar, compounds output over time while protecting legacy production.
Third-Party Validation: Independent engineering reviews keep turnaround plans honest. The flagship project, PetroVybe ONE, carries a $48MM proved reserves (PV-09) valuation from a licensed third-party engineering firm, grounding the plan in verified data rather than optimistic projections.
Common Barriers That Stall Asset Productivity
Even strong assets stall out when three problems go unaddressed.
Poor data visibility. When production accounting is unclear or ownership of tracking responsibility is fuzzy, wells underperform without anyone noticing until the decline is already severe. This risk compounds in leasehold portfolios with multiple legacy operators and inconsistent record-keeping.
Deferred maintenance. Skipping scheduled workovers accelerates the decline curve and permanently erodes recoverable reserves. A well left too long often can't be brought back to its original productivity ceiling.
Lack of specialized technical expertise. Many operators don't have in-house petroleum engineering or geological talent capable of correctly ranking which wells deserve workover, optimization, or drilling capital. PetroVybe addresses this directly by keeping that expertise in-house:
- Michael Stamatedes (Chief Geophysicist): drilling location and prospect evaluation
- Clayton Riddle (CFO, petroleum engineer): workover economics and capital allocation
- Blaine Yeary (President/COO): operational scaling and asset optimization
- Luke McIntosh (VP Asset Intelligence & Performance): ongoing production monitoring
Measuring Turnaround Success: KPIs Investors Should Track
MOIC and IRR
These remain the ultimate scorecards. MOIC measures total value returned divided by capital contributed, while IRR measures the annualized rate of return across the life of the investment.
ILPA's reporting standards define both terms precisely and recommend reporting each gross and net of fees. PetroVybe ONE targets a 10-year MOIC of roughly 2.2-5.8x and an ~26% IRR, giving investors a benchmark for whether the underlying turnaround is actually creating value.
Production Growth and Reserve Additions
Rising BOEPD and growing proved reserves are leading indicators, showing momentum before quarterly financials confirm it. Investors should look for sustained growth across several quarters rather than a single strong month tied to one well.
PetroVybe's own numbers show what this looks like in practice:
- Scaled production from zero to roughly 1,300 BOEPD across ~400 producing wells and 58,000 acres
- Increased one project's fair market value 21x through targeted reinvestment
- Exceeded quarterly production plans by 33% while running EBITDAX-positive
Reserve growth without matching cash flow is often a red flag, signaling inflated projections rather than a genuine turnaround.
Tax Efficiency
IDC deductions and depletion allowances amplify after-tax returns for qualifying investors holding a working interest. PetroVybe's 2024 partners saw 91-94% first-year tax deductions against active income, combining IDC treatment with depletion and depreciation-driven deductions. Eligibility depends on investor status and liability structure, so this isn't automatic for every capital source.
Operational Execution Stability
A hidden but telling KPI: can the team scale without falling apart? PetroVybe grew its team 10x with 94% retention in 1.5 years, a signal that operational gains are built to last, not a one-time sprint.
Frequently Asked Questions
What is asset productivity?
Asset productivity measures the value or output an asset generates relative to the capital invested in it. It's distinct from simple uptime tracking, which only shows whether the asset is running.
How do you calculate asset productivity?
The basic formula is output divided by capital or asset base employed. In oil and gas, this typically translates to production (BOEPD) relative to capital deployed or proved reserves.
What is the difference between asset productivity and asset utilization?
Utilization measures how much an asset is used; productivity measures how much value it creates relative to its full potential. A fully utilized well can still be unproductive if returns per dollar invested are low.
Why do asset productivity turnarounds fail?
The most common failure points are poor data visibility, deferred maintenance that accelerates decline, and a lack of in-house technical expertise to prioritize capital correctly.
How long does an asset productivity turnaround typically take in oil and gas?
Timelines vary by lever. Workovers can show results within months, while acquisitions and new drilling programs often take years to fully compound into measurable returns.
Why should investors care about asset productivity?
Asset productivity drives MOIC and IRR directly. For accredited investors in private oil and gas development, strong asset productivity means passive income compounds year over year instead of capital sitting idle.