
Functional distribution asks a simple question: how does a nation's total income split between labor (wages, salaries, benefits) and capital (profits, rent, interest)? That's different from asking which households earn the most, which is personal distribution. A single household can earn both a salary and rental income at the same time, blurring the line between the two.
This piece breaks down functional distribution, compares it to personal and size distribution, traces the contemporary shift toward capital, and explains why the split matters for anyone building long-term wealth today.
Key Takeaways
- Functional distribution splits income by source (labor vs. capital); personal distribution ranks households by total income
- G7 labor share has fallen roughly 12% since the 1970s, even as inequality kept climbing
- Wage dispersion within labor income, not the labor-capital split, drives most of the rise in inequality
- Capital income compounds and is taxed differently than wages, giving investors a lever most workers lack
What Is Functional Distribution of Income?
Functional distribution measures how a country's total output, its GDP or national income, gets divided among the factors that produced it: labor, capital, and land. Two components matter most:
- Labor share: wages, salaries, and benefits paid to workers
- Capital share: corporate profits, rents, interest, and dividends flowing to capital owners
This isn't a new idea. Classical economists built entire theories around it.
Classical Roots: Ricardo and Smith
David Ricardo called the division between wages and profits "the principal problem of political economy." Adam Smith laid the groundwork with his three-way split of wages, rent, and profit, though his focus stayed on institutional fairness rather than pure factor accounting.
For most of the 20th century, economists treated this split as settled. Nicholas Kaldor's 1961 "stylized facts" assumed labor's share stayed roughly constant, an assumption baked into the Cobb-Douglas production function still taught in intro economics classes today.
Public concern about the labor-capital split resurfaced in the mid-2000s, when strong corporate profits coincided with stagnant wages. The 2008 financial crisis deepened the scrutiny, as bank rescues flowed to capital while unemployment and inequality climbed for everyone else.
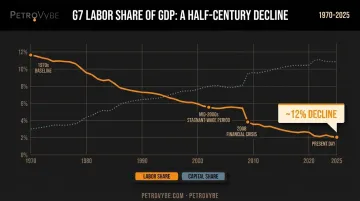
Labor's share of income across the G7 has fallen by roughly 12% since the 1970s, according to IMF research on functional income distribution. That's a relative decline, not a 12-percentage-point crash, but on multi-trillion-dollar economies, even a modest shift redirects hundreds of billions of dollars from paychecks toward profits every year.
Functional distribution says nothing about who receives labor or capital income. A small business owner drawing a salary while also collecting rental income on a duplex participates in both categories simultaneously. That's exactly why this measure gets confused with personal distribution, which we'll untangle next.
Functional vs. Personal vs. Size Distribution of Income
These three terms get used interchangeably in casual conversation, but they measure completely different things, and confusing them leads to muddled policy debates and worse investment decisions.
Functional vs. Personal Distribution of Income
Personal distribution measures how total income spreads across individuals or households, period. It doesn't care whether that income arrived as a paycheck or a dividend check.
Consider two households each earning $150,000 a year: Household A earns it entirely through two W-2 salaries, while Household B earns $50,000 in wages plus $100,000 in rental and dividend income. Personal distribution treats these households identically, since their totals match, but functional distribution captures the difference instantly.
The BEA tracks this in practice through its Distribution of Personal Income data, ranking households into quintiles. The 2024 provisional figures show how concentrated income already is:
| Household quintile | Share of total personal income |
|---|---|
| Bottom 20% | 5.3% |
| Second 20% | 9.5% |
| Middle 20% | 13.4% |
| Fourth 20% | 19.0% |
| Top 20% | 52.8% |
Source: BEA's Distribution of Personal Income data
Over half of all personal income concentrates in the top fifth of households. Notice, though, that this table says nothing about whether that top-quintile income came from salaries or capital gains; that's a separate question entirely.
Functional vs. Size Distribution of Income
Size distribution is really just a technique for measuring personal distribution: it ranks households or individuals into ordinal groups, quintiles, deciles, whatever slice you want, based purely on income amount.
Size distribution and personal distribution answer the same underlying question: how much income does each household get? Functional distribution answers a completely different question: where did that income come from?
| Concept | What It Measures | Example Metric |
|---|---|---|
| Functional distribution | Income split by production factor (labor vs. capital) | Labor share of GDP |
| Personal distribution | Income spread across individuals or households | BEA household income by quintile |
| Size distribution | Ranked income groups by amount | Quintile shares, Gini coefficient |
Source-based versus recipient-based measurement: that's the whole distinction.
The Contemporary Shift: Declining Labor Share & Rising Capital Concentration
We already saw the headline number: G7 labor share has fallen roughly 12% since the 1970s, even as income inequality climbed steadily across nearly every advanced economy. The timing isn't coincidental, but the causal story runs deeper than "capital ate labor's lunch."
Economists point to four overlapping drivers:
- Globalization: Offshoring and global value chains let firms substitute cheaper foreign labor and inputs, weakening domestic wage bargaining power
- Financialization: Corporate profits increasingly flow to shareholders and financial activities rather than production wages
- Reduced unionization: Declining union membership stripped workers of collective bargaining leverage across advanced economies
- Cheaper capital goods: Falling relative prices for machinery, software, and equipment made substituting capital for labor more attractive
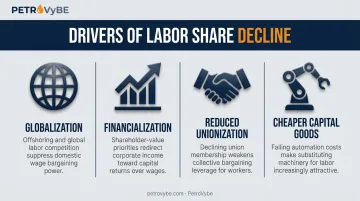
No single mechanism explains the decline everywhere. Researchers who've reviewed the evidence across countries and industries find the pattern sensitive to how it's measured, with no one theory holding up in every case.
Why AI Changes the Calculus
This history matters right now because AI and automation accelerate the same forces that drove labor share down for fifty years. Every dollar a company spends on GPUs, data centers, or robotic process automation instead of headcount pushes the functional split further toward capital.
IMF modeling of AI adoption suggests the aggregate capital share could climb several more percentage points over coming decades, with faster gains where firms adopt automation aggressively. That's a projection, not a foregone conclusion, but it points in the same direction the last fifty years already established: capital's claim on national income keeps growing.
For anyone trying to forecast where future income growth lands, functional distribution is a leading indicator worth tracking closely.
Why Functional Distribution Matters for Today's Investors
Here's the twist: research shows the labor-capital split isn't even the primary driver of inequality. IMF research examining household survey data across 43 countries between 1978 and 2010 found that a 10% rise in wage dispersion, meaning gaps between what different workers earn, raises market income inequality by more than 9%.
A 10% decline in labor share raises inequality by less than 1% by comparison. Wage inequality within labor income matters more than the labor-versus-capital divide.
So why should investors care about functional distribution at all? Because capital ownership remains the one lever individuals can actually pull to change their own income mix, even if it isn't the main inequality driver.
The ownership numbers back this up. Among the top 1% of earners, 69% report some pass-through business income; among the top 0.1%, that figure jumps to 84%, according to NBER research on business incomes at the top. Wages alone rarely built the largest fortunes. Business and capital ownership did.
Workers who depend entirely on wage income stay fully exposed to:
- Wage stagnation during recessions or automation waves
- Inflation eroding real purchasing power
- Shifting labor-share trends entirely outside their control
Capital owners face different risks, but they also access different rewards, including tax treatment engineered specifically to encourage investment.
Tax Treatment: The Structural Advantage
Capital income and labor income aren't taxed the same way. Long-term capital gains max out at 20% federally for most taxpayers, versus ordinary rates climbing to 37% on W-2 wages. Beyond rates, capital investments unlock deductions labor income never sees, including depreciation and, in energy specifically, intangible drilling cost (IDC) deductions.
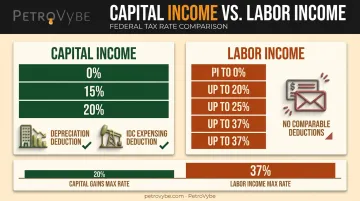
That's deliberate policy designed to incentivize domestic capital formation, particularly in energy production. It's also precisely why the AI-driven energy demand story matters for functional distribution today. As data centers push electricity demand higher, capital deployed into natural gas and power-generation assets captures a growing share of factor income. Owners of that capital, not just its workers, benefit directly from the shift already underway.
Moving From Labor Income to Capital Income: A Practical Example
PetroVybe offers a concrete illustration of this shift in action. The Texas-based natural gas developer gives accredited investors a way to convert taxed, active W-2 income into direct ownership of capital assets, specifically natural gas development projects in Lavaca and Colorado Counties, part of the South Texas Gulf Coast Basin.
How the Structure Works
Accredited investors who commit a minimum of $100,000 in liquidity gain a direct partnership interest in producing and developing natural gas assets. The mechanism runs through intangible drilling cost deductions, a long-standing tax provision that lets investors deduct the majority of drilling costs against active income the same year they invest.
Unlike real estate deductions, which typically apply only against passive income unless an investor qualifies as a real estate professional, IDC deductions apply directly against W-2 wages and capital gains, with no passive-income restriction.
PetroVybe partners have seen this play out in practice:
- 91% tax deduction against active income for 2025 partners
- 94% tax deduction against active income for 2024 partners
- Roughly 70% of that deduction landing in year one
For someone who just sold a business or vested a large equity grant, this converts a meaningful chunk of this year's tax bill directly into an ownership stake in a cash-flow-producing asset.
From Deduction to Distribution
The tax deduction is just the starting point. Once wells begin producing, investors move into a multi-year stream of capital income, with PetroVybe's return targets including:
- Monthly passive distributions projected to peak above $10,000 during high-production months
- A 10-year target MOIC of roughly 2.2x to 5.8x
- A target IRR near 26%
Those figures are forward-looking projections, not guarantees. Actual results depend on commodity pricing, drilling outcomes, and operational execution.
Execution matters as much as the tax mechanics. PetroVybe's projects lean on a chief geophysicist with a 48-year track record and a 75.2% well-success rate, well above the industry average of under 40%, since location selection determines whether the underlying production curve ever materializes.

A household that shifts even a portion of its income from pure W-2 wages into direct capital ownership changes its own personal functional distribution, deliberately, and on its own terms.
Frequently Asked Questions
What is the functional distribution of income?
It's the division of a nation's total income between labor (wages, salaries, benefits) and capital (profits, rent, interest). It's distinct from how income spreads across individual households.
What is the difference between personal and functional distribution of income?
Personal distribution ranks households by total income received, regardless of source. Functional distribution categorizes income by where it came from: labor or capital.
What is the difference between size and functional distribution of income?
Size distribution groups households into quantiles, such as quintiles or deciles, based purely on income amount. Functional distribution is source-based and ignores who actually receives the income.
Why has the labor share of income declined globally?
Globalization, automation and technological change, reduced union bargaining power, and falling relative prices for capital goods have all contributed, according to IMF and academic research on labor share trends. No single factor explains the entire trend.
How is capital income taxed differently than labor income?
Long-term capital gains benefit from preferential rates (0%, 15%, or 20% federally), while W-2 wages face ordinary rates up to 37%. Capital investments also unlock deductions like depreciation and IDC expensing unavailable to standard wage income.
Can accredited investors benefit from shifting toward capital income?
Yes. Direct capital ownership positions, such as natural gas development interests, let accredited investors build tax-advantaged passive income streams that reduce reliance on W-2 wages alone.