
This gap explains a strange but common phenomenon: high earners who feel financially anxious despite six-figure salaries. Nearly 41% of Americans earning between $100,000 and $250,000 report living paycheck to paycheck, according to a CNBC/SurveyMonkey poll. They're asset rich, or income rich, but cash poor, because they're tracking the wrong metrics.
This guide breaks down the wealth indicators that actually matter: five core financial metrics, the widely cited seven-levels framework, and the behavioral signals that distinguish genuine wealth from a high paycheck.
Key Takeaways
- Net worth alone doesn't reveal trajectory—savings rate, cash flow, and debt ratios do
- Five core metrics benchmark real wealth: net worth, savings rate, passive income, debt ratio, and required return
- Grant Sabatier's seven-level framework shows most people plateau at "self-sufficiency" by relying on earned income alone
- Tax-advantaged direct investments can improve multiple indicators simultaneously, not just net worth
What Are Wealth Indicators?
Wealth indicators are the measurable financial and behavioral signals used to assess someone's actual financial position and trajectory, not a single net worth snapshot taken on one day. They include savings behavior, income sources, debt levels, and how efficiently assets compound over time.
The distinction that matters most: income is money earned, while wealth is what's retained and put to work. A surgeon making $400,000 a year can have less actual wealth than a teacher who saved consistently for three decades.
Federal Reserve data backs this up. From 2019 to 2022, real median family income rose just 3%, while real median net worth climbed 37%, according to the Federal Reserve's Survey of Consumer Finances. Income and wealth simply don't move together.
Traditional Wealth Indicators
For decades, wealth was inferred from visible signals:
- Profession and job title
- Real estate holdings and home size
- Size and visibility of charitable giving
- Board seats or foundation affiliations
These markers still carry weight, but they're incomplete. A large home can be 90% mortgaged. A prestigious title doesn't guarantee a healthy balance sheet.
Intangible Wealth Indicators
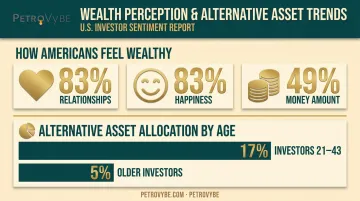
Since luxury goods have become more accessible, differentiation has shifted toward where capital is placed rather than what's purchased. A 2025 Schwab Modern Wealth Survey found that 83% of respondents felt wealthy in relationships and 83% in happiness, compared to just 49% who felt wealthy based on the amount of money they had.
Among wealthier households, capital allocation itself has become the status signal. Investors ages 21-43 with at least $3 million in investable assets allocated 17% of their portfolios to alternative assets, compared to just 5% among older respondents, per Bank of America's 2024 Private Bank study. Tax strategy, education investment, and private-market access have become the new differentiators.
The 5 Key Metrics That Measure Real Wealth
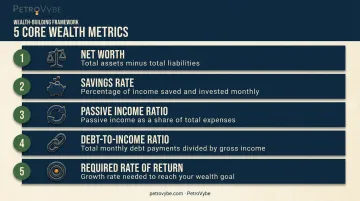
Financial professionals rely on five core metrics to evaluate wealth beyond a single net worth figure. Each one measures a different dimension of financial health.
Net Worth: The Starting Point
Net worth equals total assets minus total liabilities. It's the foundation of any wealth assessment, but it's insufficient alone, especially when most of that value sits in illiquid or leveraged assets like a heavily mortgaged home or an underwater business interest.
A $3 million net worth means little if $2.7 million is tied up in real estate with no cash flow attached.
Savings Rate: The Engine of Wealth Creation
The percentage of income saved and invested often predicts long-term wealth better than income level itself. Two people earning the same salary can end up in dramatically different financial positions based purely on savings discipline.
Example: Someone saving 10% of a $150,000 salary accumulates roughly half the wealth over 20 years compared to someone saving 20%, assuming similar investment returns. The gap compounds every year.
Cash Flow & Passive Income Ratio
The Passive Income Ratio divides passive income by total expenses. It answers one question directly: how much of your lifestyle could your assets fund without you working another day?
- Below 25%: You're still dependent on wages for daily expenses
- Between 25% and 99%: Assets cover part of your lifestyle, but wages fill the gap
- 100% or above: Your assets fully fund your lifestyle, marking financial independence
Wealthy individuals consistently prioritize income generated by assets, such as dividends, real estate rents, or royalties from energy investments like oil and gas wells, over wage income. Fidelity separately uses a 33x annual expenses rule of thumb (based on a 3% withdrawal rate) as one financial-independence planning convention.
Debt-to-Income Ratio
This ratio divides total monthly debt payments by gross monthly income. A declining DTI signals improved liquidity and more financial flexibility. Lenders often cap this around 43% for mortgage qualification, though the Consumer Financial Protection Bureau notes that limits vary by lender and product.
Required Rate of Return
This is the annual return needed to hit a specific financial goal within a given timeframe. Adjusting your savings rate or timeline directly changes this target.
- Saving more monthly lowers the required return needed from investments
- Extending your timeline reduces the annual return threshold
- Compressing your timeline raises the risk you need to accept
The 7 Levels of Wealth Explained
Self-made millionaire Grant Sabatier popularized a widely cited seven-level wealth framework, referenced across CNBC's financial independence coverage. It maps financial progress far more precisely than net worth alone.
| Level | Stage | What It Looks Like |
|---|---|---|
| 1 | Clarity | Full inventory of debts, income, and goals |
| 2 | Self-sufficiency | Covers expenses without outside help, possibly still paycheck to paycheck |
| 3 | Breathing room | Money left over for savings and investing after expenses |
| 4 | Stability | High-interest debt paid off, roughly six months of expenses saved |
| 5 | Flexibility | Two-plus years of expenses saved, real choice over work |
| 6 | Financial independence | Investments generate enough income to cover living costs |
| 7 | Abundant wealth | More money than is realistically needed |
Half of U.S. workers sit at Level 2, according to a MagnifyMoney survey cited by CNBC. That's the plateau point. Most people stall here because they're relying entirely on earned income rather than asset-generated income.
Each level up requires tracking a different metric:
- Level 1-2: Full inventory of debts and income, plus enough earned income to cover expenses without outside help.
- Level 3-4: Savings rate, how much of your income you keep and invest each month.
- Level 6+: Passive income ratio, investment income divided by living expenses. Reaching Level 6 or 7 typically requires diversifying beyond traditional stocks, bonds, and real estate into asset classes built for stronger cash flow and tax efficiency, such as direct energy or private credit investments, since public market returns alone rarely accelerate that jump.
Signs Someone Is Truly Wealthy
Genuine wealth shows up in behavior more than possessions. Ramsey Solutions' study of over 10,000 millionaires found some consistent patterns:
- 94% lived on less than they made, and nearly three-quarters never carried a credit card balance
- 75% attributed success to regular, consistent investing rather than windfalls
- 79% received no inheritance at all, and only 3% inherited $1 million or more
Beyond spending discipline, wealthy individuals typically hold multiple income streams and own assets that produce income rather than ones that simply depreciate. Northwestern Mutual's research found **69% of millionaires work with a financial advisor**, versus 33% of the general population, suggesting structured planning plays a real role.
Perhaps the most modern sign of wealth isn't visible at all: peace of mind. Reduced financial anxiety and control over your own time matter more than a driveway full of luxury cars.
That mindset shows up in portfolio construction too. High-net-worth investors under 44 allocate 17% to alternative assets like private equity and direct energy investments, compared to just 5% among older cohorts. PetroVybe's direct oil and gas partnerships fit squarely into that shift, giving accredited investors a similar route beyond pure public-market exposure.
How Strategic Alternative Assets Strengthen Your Wealth Indicators
Most assets improve one metric at a time. A savings account helps net worth. A stock portfolio helps net worth and, eventually, passive income.
But few asset classes move net worth, cash flow, and debt-to-income ratio simultaneously. That's exactly why alternative direct investments have gained ground among high earners looking to close the gap between income and actual wealth.
Tax-advantaged direct investments, such as natural gas development, work through a mechanism most investors haven't considered. Intangible Drilling Cost (IDC) deductions apply against active income, including W-2 wages and capital gains, not just passive income.
That's a meaningful distinction from real estate, where deductions are typically restricted to passive income unless you qualify as a full-time real estate professional.
This is the core of what PetroVybe offers accredited investors through its natural gas development projects in South Texas's Lavaca County. Partners who joined in 2024 received a **94% tax deduction against active income**; 2025 partners received 91%. That deduction directly:
- Frees up cash flow by reducing current-year tax liability, improving effective debt-to-income capacity
- Builds toward the Passive Income Ratio through monthly distributions projected to exceed $10,000 per unit during peak production
- Lowers the Required Rate of Return needed elsewhere in a portfolio, since part of the return arrives as an immediate tax offset

Realizing these benefits depends on the investment structure itself. The program requires:
- A $100,000 minimum investment and accredited investor status
- Distributions beginning two to three years after initial investment, as wells move from development into production
These production assumptions rest on a real track record: PetroVybe's chief geophysicist carries a 75.2% career hit rate on well selection, against an industry average below 40%.
Frequently Asked Questions
What are the 7 levels of wealth?
The framework progresses from clarity and self-sufficiency through breathing room, stability, flexibility, financial independence, and abundant wealth. Each level requires a different financial focus, from covering expenses to living entirely off asset income.
What are the 5 measures of wealth?
The five core metrics are net worth, savings rate, cash flow/passive income ratio, debt-to-income ratio, and required rate of return. Together they capture accumulation, behavior, income sources, liquidity, and goal progress.
What are signs someone is wealthy?
Common signs include multiple income streams, spending well below net worth, consistent investing habits, and ownership of income-producing assets rather than depreciating ones. Reduced financial anxiety is an increasingly cited modern indicator too.
What is a wealth indicator?
A wealth indicator is a measurable financial or behavioral signal that assesses someone's true financial position, going beyond a single net worth figure. It includes cash flow, savings behavior, and debt levels.
How does passive income affect wealth indicators?
Passive income directly raises the Passive Income Ratio and reduces reliance on earned wages. As that ratio climbs, someone moves faster through the higher levels of the wealth framework toward financial independence.
What's the difference between income and wealth?
Income is money earned during a given period, like a salary or bonus. Wealth is the accumulation of assets that compound and generate future income, independent of continued work.