
That's the gap Cash Flow Return on Investment (CFROI) was built to close. Developed by HOLT Value Associates and later carried forward by Credit Suisse and UBS, CFROI strips away accounting noise to show what a business actually earns in cash, compared to what it costs to run.
This matters just as much for public equities as it does for private deals like natural gas development, where there's no stock ticker to tell you if you're overpaying. This guide walks through the formula, a step-by-step calculation, how to interpret your results, and how the same "prove the cash, not the projection" thinking applies when you're evaluating alternative investments.
Key Takeaways
- CFROI measures cash-based economic return, making it harder to manipulate than ROE or ROIC.
- Formula: Operating Cash Flow ÷ Capital Employed, with an IRR-based version for multi-year analysis.
- Returns above your cost of capital (WACC) signal value creation; below it, value destruction.
- The same cash-verification discipline applies to oil and gas partnerships, using reserve reports instead of market pricing.
What Is Cash Flow Return on Investment (CFROI)?
CFROI measures a company's economic, cash-based return relative to its cost of capital. Unlike ROE or ROIC, which lean on reported net income, CFROI runs on actual cash generation. That distinction matters more than it sounds.
Two companies can post identical earnings per share while one funds growth through real operating cash and the other leans on aggressive depreciation assumptions or one-time gains. CFROI exposes that difference.
Where CFROI Came From
The methodology traces back to Bartley J. Madden's work at Callard, Madden & Associates, later commercialized through HOLT Value Associates in the 1990s. Credit Suisse acquired HOLT in 2002, and following the UBS-Credit Suisse merger, the framework now operates as UBS HOLT.
HOLT's own materials describe it as treating a company like a portfolio of projects, each with its own useful life and cash-generating capacity.
Why It's Conceptually an IRR
Here's the part most investors miss: CFROI isn't really a single ratio. It's a firm-wide Internal Rate of Return (IRR), calculated across all of a company's assets and compared against a hurdle rate, typically the weighted average cost of capital (WACC).
A few features set CFROI apart:
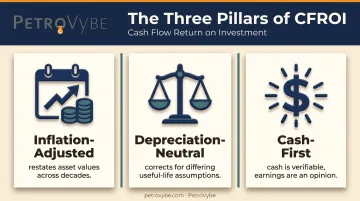
- Inflation-adjusted: Asset values are restated for inflation, making companies comparable across decades and accounting regimes.
- Depreciation-neutral: The math corrects for one company depreciating assets over 5 years while a competitor stretches the same assets across 15.
- Cash-first: Cash is verifiable. Earnings are an opinion.
The CFROI Formula Explained
The simplified version most analysts reference is:
CFROI = Operating Cash Flow (OCF) ÷ Capital Employed (CE)
This shorthand comes from Investopedia's breakdown of the metric and works well for quick comparisons. The full HOLT model is more involved, solving for an IRR across gross investment, projected cash flows, and the terminal recovery of non-depreciating assets. For most investors, the simplified ratio gets you 90% of the insight with a fraction of the effort.
Operating Cash Flow (OCF)
OCF starts with net income and adjusts for the non-cash stuff that distorts it:
- Add back depreciation and amortization
- Add back deferred taxes
- Adjust for changes in working capital (receivables, payables, inventory)
The result is the actual cash a business threw off from running its core operations, no financing or investing activity included.
Capital Employed (CE)
You'll see two common approaches, and consistency matters more than which one you pick:
- Fixed Assets + Working Capital
- Total Assets − Current Liabilities
Both should land in roughly the same neighborhood. Pick one and stick with it across every company you compare.
The Hurdle Rate: Where WACC Comes In
CFROI on its own tells you nothing. You need a benchmark, and that benchmark is almost always WACC. Subtract WACC from CFROI and you get Net CFROI:
Net CFROI = CFROI − WACC
A positive number means the business is creating value above its cost of capital. A negative one means it's burning value, even if net income looks fine on paper.
CFROI isn't the only benchmark of this kind, either. Deutsche Bank's CROCI methodology takes a separate, proprietary approach, standardizing hundreds of accounting line items differently than HOLT does. The two aren't interchangeable, so treat a CROCI figure as its own metric rather than a stand-in for CFROI.
How to Calculate CFROI: A Step-by-Step Example
Let's build a simple hypothetical oil and gas development company and walk through the math.
Given inputs:
- Net income: $2,000,000
- Depreciation: $500,000
- Change in working capital: -$100,000
- Total assets: $15,000,000
- Current liabilities: $3,000,000
Step 1: Calculate Operating Cash Flow
Net Income + Non-Cash Expenses + Changes in Working Capital:
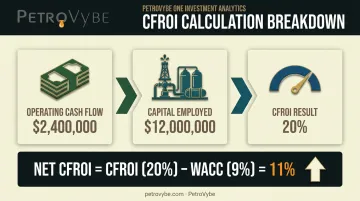
$2,000,000 + $500,000 − $100,000 = $2,400,000
Step 2: Calculate Capital Employed
Total Assets − Current Liabilities:
$15,000,000 − $3,000,000 = $12,000,000
Step 3: Apply the CFROI Formula
$2,400,000 ÷ $12,000,000 = 20% CFROI
In plain terms: for every dollar tied up in the business, it's generating 20 cents of real cash return annually. Now compare that to a WACC of, say, 9%:
Net CFROI = 20% − 9% = 11%
That positive 11-point spread signals the company is creating real shareholder value on top of its stated profit. Flip the WACC to 22% and suddenly that same 20% CFROI signals value destruction, even though the company hasn't changed a single operational decision.
One forecasting note: industries with fast-depreciating assets (think tech hardware or certain drilling equipment) tend to see CFROI decline over time as replacement costs rise faster than cash generation. Projecting future cash flows requires estimating remaining asset life, not just extrapolating last year's numbers.
Interpreting CFROI: What a Good Score Looks Like
A single year of CFROI tells you almost nothing useful. The real signal comes from the trend.
The real signal comes from the trend.
Here's what to watch for:
- CFROI consistently above WACC across multiple years points to durable, well-managed capital allocation.
- CFROI trending below WACC over time suggests the company is eroding value even if revenue keeps climbing.
- A widening spread (CFROI minus WACC growing) often precedes stock price re-ratings, since the market eventually catches up to fundamentals.
A company posting 14% CFROI against a 9% WACC for five straight years is compounding value the market hasn't priced in.
Investors often overlay a company's historical CFROI trend against its stock price. When the two diverge, meaning CFROI is climbing while the stock lags, or vice versa, it can signal a mispriced stock, one worth flagging for a deeper valuation review.
CFROI vs. Other Return Metrics (ROE, ROIC, IRR, ROI)
It helps to see these side by side.
| Metric | What It Measures | Key Limitation |
|---|---|---|
| ROE | Net income ÷ shareholder equity | Can be inflated by debt or buybacks |
| ROIC | NOPAT ÷ invested capital | Still accounting-based, not cash-based |
| CFROI | Cash-based economic return vs. cost of capital | Requires more data and adjustment |
| Plain ROI | Total gain relative to cost | Ignores timing and holding period |
| IRR | Annualized, time-adjusted return | Sensitive to cash flow timing assumptions |
ROE and ROIC lean on accounting profit. That means they're vulnerable to depreciation policy choices, one-time write-offs, and aggressive revenue recognition. CFROI sidesteps most of that by working from cash.
Plain ROI vs. CFROI/IRR is a distinction that trips people up constantly. A "20% ROI" simply means an investment returned 20% of its original cost, full stop. It says nothing about whether that happened in one year or seven. CFROI and IRR annualize and cash-adjust that return over the entire holding period, which is a far more useful number for comparing opportunities.
So what counts as a "good" IRR? It depends heavily on asset class. PitchBook's benchmark data shows five-year horizon IRRs ranging from roughly **6% for oil and gas funds** up to 21% for buyout funds, with infrastructure sitting around 10%.
These are pooled, capital-weighted figures, not targets for any single deal, but they give you a reasonable range to sanity-check against. For context, PetroVybe's natural gas development projects target a 10-year IRR near 26%, showing how a specific, vetted deal can outperform broader private equity benchmarks.
Applying CFROI Thinking to Alternative Investments Like Oil & Gas Development
Public companies get priced every day by millions of market participants. Private deals don't have that luxury. There's no ticker telling you if a real estate syndication, a private credit fund, or a natural gas development project is fairly valued. That's exactly why cash-flow-first thinking matters even more in these spaces.
At PetroVybe, this shows up in how the company structures its natural gas development projects. The firm targets a 10-year MOIC of roughly 2.2x to 5.8x and an IRR of approximately 26%, and it doesn't ask investors to take those numbers on faith:
- Independent reserve valuation: a $48 million PV-09 proved reserves figure, determined by a licensed third-party engineering firm, not an internal projection
- Licensed operator oversight: PetroVybe OpCo LLC holds an active Texas Railroad Commission operator license, verifiable by anyone at rrc.texas.gov
- Public well-level records: API well numbers let investors confirm specific wells exist and are in good regulatory standing

This is the same discipline CFROI enforces on public equities. Verify the actual operating cash flow, verify the actual capital employed, and compare the result to your own hurdle rate before deciding whether value is really being created.
The Tax Layer Changes the After-Tax Math
Tax treatment adds another variable to this math. PetroVybe partners in 2024 and 2025 reported 91% to 94% deductions against active income through Intangible Drilling Cost provisions, covering W-2 earnings and capital gains alike.
That front-loaded deduction reduces effective net capital at risk in year one. It shifts the after-tax return picture well beyond what the pre-tax IRR target alone would suggest.
Whatever the alternative asset, the question is the same one CFROI forces on you: is this cash flow real and verified, or is it a paper projection? If a sponsor can't answer that clearly, that's worth treating as a red flag.
Frequently Asked Questions
What is cash flow return on investment?
CFROI is a cash-based valuation metric that compares a company's economic return to its cost of capital. HOLT Value Associates developed it to reveal true cash generation rather than reported accounting earnings.
How to calculate cash flow return on investment?
The basic formula is Operating Cash Flow divided by Capital Employed. See the step-by-step example above for a full walkthrough using sample net income and balance sheet figures.
What is a good IRR for 5 years?
It depends heavily on asset class and risk. Private market benchmarks range from roughly 6% for oil and gas funds to over 20% for buyout funds, so compare results against your own hurdle rate.
What does a 20% ROI mean?
A 20% ROI means an investment returned 20% of its original cost, with no adjustment for how long that took. Unlike IRR or CFROI, it ignores the timing of cash flows entirely.
What is a good CFROI?
A CFROI that consistently exceeds the company's WACC, or hurdle rate, over multiple years is considered good since it signals real value creation rather than value erosion.
Is CFROI the same as IRR?
CFROI is conceptually equivalent to a firm-wide IRR applied across all of a company's investment projects at once, rather than the IRR calculated for one single project or investment.