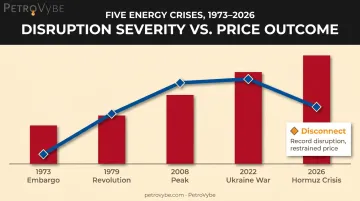
Then something strange happened. Brent crude never even matched its 2008 or 2022 peaks.
Drivers braced for rationing. Investors braced for inflation shockwaves. Neither fully materialized, at least not yet. That gap between the forecast catastrophe and the realized price has left plenty of people wondering what actually happened, and whether the calm is built to last.
This piece breaks down the four real reasons prices stayed contained, why Brookings and IEEFA both warn the reprieve has an expiration date, and what it means for anyone eyeing US natural gas as a hedge against the next shock.
Key Takeaways
- Trader psychology, alternative supply, demand pullback, and stockpile releases kept oil below the 2008 and 2022 peaks.
- Structural buffers like pipeline bypass offer permanent relief; temporary reserves drain within months, not years.
- Developing nations already face fuel queues; wealthier nations have more time, not immunity.
- US natural gas and shale output remain among the few structural cushions against a 1970s-style crisis.
The Crisis That Was Supposed to Break the World
Before the conflict, roughly 20 million barrels a day of oil and refined products moved through the Strait of Hormuz, according to IEA data: about 25% of all seaborne oil trade and nearly 20% of global LNG trade.
When flows collapsed to just 3.8 million barrels a day in early April, then averaged 2.7 million barrels a day through spring, the IEA called it the largest disruption in history, eclipsing even the 1970s embargoes.
That comparison matters. The 1973 Arab oil embargo and the 1979 Iranian Revolution both triggered gas lines and rationing across the US with supply losses far smaller than what Hormuz represented in 2026. Reuters' own analysis found the 2026 daily disruption actually exceeded the peak daily losses of those earlier shocks, yet the price response looked nothing alike.
Compare that to 2022, when Russia's invasion of Ukraine sent Brent to its modern-era peak. Markets in early 2026 braced to blow past that benchmark entirely. JPMorgan flagged risk above $150 a barrel if disruption dragged into mid-May. Industry chatter floated numbers as high as $200.
Here's what actually happened instead:
- Brent stayed meaningfully below both the 2008 all-time high and the 2022 war peak
- This held even as the physical disruption dwarfed both historical comparisons in scale
- Bloomberg summed it up bluntly, noting oil never reached $200 despite every ingredient for a doomsday scenario being present on paper
So why the disconnect? Four forces did the heavy lifting, and none of them were permanent fixes.
Four Reasons the Crisis Has Been Held at Bay
Four forces converged at the same time, an unusual coincidence that kept a historic supply shock from turning into an equally historic price shock.
Oil Markets Bet on a Quick Resolution
Traders did something markets often do early in a crisis: they priced in a short conflict. Brent spiked but stayed well under the $147-150 range some banks initially flagged as tail risk.
That restraint had help. The world entered 2026 sitting on a surplus averaging roughly 1.9 million barrels a day through 2025, with forecasts pointing toward a surplus approaching 4 million barrels a day for the year, largely thanks to production growth from the US, Guyana, and Brazil.
A market that starts a crisis oversupplied has more room to absorb a shock than one that starts tight.
Other Producers Stepped Into the Gap
The Middle East normally supplies a substantial share of the world's crude, but it isn't the only game in town anymore. Reuters ranked the United States as the single largest contributor to global export growth in 2026, with Brazil, Guyana, and Argentina close behind.
Guyana alone pushed output past 900,000 barrels a day, with roughly 140,000 barrels a day of additional growth forecast for the year.
Even barrels from unexpected corners found their way to market. Russian crude, still moving despite sanctions, kept flowing at elevated volumes throughout the conflict.
Global Demand Pulled Back
A crisis this size doesn't just squeeze supply, it crushes demand too. The IEA's May outlook cut its 2026 demand forecast by 420,000 barrels a day, landing at 104 million barrels a day, or 1.3 million barrels a day below where the agency expected demand before the war started.
Asia absorbed most of that pullback as fuel costs and rationing measures forced consumers and industry to cut back.
Fewer barrels needed means fewer barrels missed. Not a comfortable way to balance a market, but it worked.
Nations Are Burning Through Stockpiles
The single biggest lever was stockpiles. IEA member countries authorized a record 400-million-barrel coordinated release, the largest emergency stock release in the agency's history. China reportedly leaned on commercial reserves large enough to cover months of Hormuz-dependent imports on its own.
The toll hasn't been even:
- Bloomberg documented fuel hoarding and rationing spreading across parts of Asia
- The Philippines adopted a temporary four-day workweek
- Pakistan pushed conservation messaging as fuel grew scarce
- Hundreds of Australian filling stations reported shortfalls
Wealthier nations, meanwhile, leaned on coordinated reserve releases and energy diplomacy instead of rationing at the pump. That gap matters, because reserves don't last forever.
The Hidden Countdown: Why the Reprieve Is Running Out
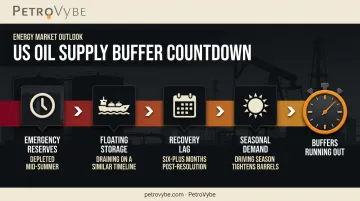
Everything holding oil prices down falls into one of two buckets: structural offsets that work indefinitely, and temporary buffers with a shelf life. The first bucket is comforting. The second is running out right now.
Structural offsets are the permanent kind. Saudi Arabia's East-West pipeline can move up to 7 million barrels a day around the strait entirely, and the UAE's pipeline to Fujairah adds another 1.8 million barrels a day of bypass capacity. Combined with the pre-war supply surplus, these offsets replace a meaningful chunk of lost Hormuz flow without needing renewal.
Temporary buffers are the opposite. They get spent, and once they're gone, they're gone. Brookings estimated the emergency-stock cushion could be exhausted by July or August if disruption continued at pace.
Floating storage faces a similar timeline. IEEFA separately noted that even after a resolution, oil flows could take at least six months to climb back to pre-conflict levels, meaning the disruption's effects outlast the disruption itself.
Here's the math worth watching for the rest of the year:
- Emergency reserves: largely depleted by mid-summer
- Floating storage: draining on a similar timeline
- Recovery lag: six-plus months even after a deal is struck
- Seasonal demand: Northern Hemisphere driving season tightens exportable barrels right as those buffers hit empty
Put those together, and the price scenarios banks have floated start to look less exotic. JPMorgan's mid-May disruption case put risk above $150 a barrel. Goldman Sachs modeled Brent topping $120 by Q4 if disruption dragged on, though the bank framed that as a scenario, not a forecast.
None of this guarantees a spike. It means the cushion buying time right now has a countdown clock attached, and unlike pipeline capacity, that clock doesn't reverse.
Why Domestic Natural Gas Production Is America's Structural Hedge
The same shale and gas boom that built the pre-war supply surplus (the US, Guyana, and Brazil growth referenced above) is exactly why America has options import-dependent nations don't.
Recent data shows the scale of that advantage:
- US dry natural gas output hit 110.9 billion cubic feet a day in April 2026
- LNG exports reached 17.9 billion cubic feet a day, up 20.1% year over year
- The Department of Energy ranks the US as the world's largest natural gas producer and LNG exporter
That matters beyond geopolitics: electricity demand is climbing. AI data centers pull enormous, continuous electricity loads, and the base-case EIA forecast has natural gas generation climbing roughly 1.7% between 2025 and 2027.
Under a faster-adoption data center scenario, that increase more than quadruples. Natural gas remains the fuel utilities reach for when they need dispatchable power fast, exactly what a grid absorbing new data center load requires.
This is the backdrop for PetroVybe, a Texas-based natural gas developer building Natural Gas Liquids assets in Lavaca County, part of the South Texas and Gulf Coast Basin. Its flagship project, PetroVybe ONE, spans roughly 400 producing wells across 58,000 acres, with a third-party engineering firm placing proved reserves at $48 million (PV-09).
The NGL focus is deliberate:
- Natural gas liquids tend to command premium pricing at lower production cost than oil-only output
- Oil, gas, and NGLs don't move in lockstep on price, so a multi-commodity mix cushions cash flow when any single commodity weakens
- NGLs burn cleaner than crude oil, positioning production for tightening emissions standards
That's a different kind of hedge than a pipeline bypass or a strategic reserve. But it points to the same underlying truth: domestic production capacity, once built, doesn't disappear when a chokepoint half a world away gets disrupted.
Positioning Your Portfolio Before the Next Shock
Energy shocks recur: 1973, 1979, 1990, 2008, 2022, and now 2026 form a pattern, not a coincidence. Each cycle has rewarded a specific type of investor: one holding direct exposure to domestic upstream production, not just the consumer end of the energy chain.
That distinction matters more than most portfolios reflect. Owning an energy stock or an ETF gives exposure to price swings. Owning a direct stake in development, the actual wells and reserves, gives exposure to production growth and tax mechanics public equities simply don't offer.
For accredited investors, that direct exposure looks like partnerships such as PetroVybe ONE:
- Upfront tax deductions: Intangible drilling cost deductions run 60-80% of invested capital against active income, including W2 wages and capital gains; PetroVybe partners saw a 94% deduction in 2025.
- Return targets: A 10-year MOIC window of roughly 2.2x to 5.8x, with a targeted IRR near 26%, tied to a $100,000 minimum investment.
- Passive income: Monthly distributions projected to peak above $10,000 during the production phase, though first distributions typically arrive two to three years after the initial investment.
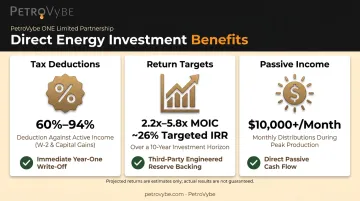
These figures are forward-looking projections, not guarantees, and carry the same commodity-price risk discussed throughout this piece. Eligibility is limited to accredited investors: individuals earning $200,000+ annually ($300,000 jointly) or holding $1 million-plus in net worth excluding a primary residence.
This kind of direct exposure isn't a replacement for stocks, bonds, or real estate in a diversified portfolio. It sits alongside them, offering something those asset classes structurally can't: a direct hedge against inflation and the next geopolitical price spike, backed by a tangible asset rather than a ticker symbol.
Given how quickly today's buffers are draining, that kind of diversification deserves evaluation before the next shock hits, not after.
Frequently Asked Questions
Will there be a gas shortage in 2026?
A full global shortage has been avoided so far through record stockpile releases and demand cuts. IEA data and bank forecasts point to tightening supply by early summer, with real strain possible by fall if the Strait of Hormuz stays constrained.
How much would gas be if oil was $200 a barrel?
Pump prices scale closely with crude costs. EIA data shows about 2.4 cents per gallon change for every $1 move in crude, so $200 oil would push US gasoline well above today's levels, adjusted for refining costs and taxes.
Who holds 80% of the world's oil?
No single bloc controls 80% of production. OPEC nations hold about 79% of proven global reserves but supplied about 36% of world crude output in 2024. Reserves and daily production are very different measures.
What is the Strait of Hormuz and why does it matter for oil prices?
It's the narrow passage between Iran and Oman connecting the Persian Gulf to open water. About 20 million barrels a day of oil and products, plus over 100 billion cubic meters of LNG, normally transit through it each year.
How does US natural gas production help offset global oil crises?
Rising US shale and gas output reduces reliance on Middle East supply and adds exportable surplus that cushions global shocks. It also creates domestic investment opportunities insulated from Hormuz-related disruption.
Is natural gas a good investment during periods of energy price volatility?
Natural gas development can offer inflation-hedged passive income, upfront tax deductions against active income, and long-term tangible asset growth. That combination appeals to accredited investors seeking diversification beyond stocks and bonds.