
That fight matters far beyond academic journals. Investment-cash flow sensitivity, or ICFS, helps investors and executives judge whether a company can fund its own growth or depends on expensive outside capital. Get the interpretation wrong, and you might mistake a thriving, reinvesting business for a distressed one.
This article breaks down what ICFS actually measures, walks through the competing theories, and translates the research into practical guidance for evaluating capital-intensive businesses, including oil and gas development companies.
Key Takeaways
- ICFS measures how closely capex tracks internal cash flow, signaling financing constraints or growth stage.
- Fazzari ties positive ICFS to constraints; Kaplan-Zingales found the opposite in unconstrained firms.
- Newer research links negative ICFS to life-cycle dynamics: young, high-growth, cash-poor firms.
- For oil and gas developers, negative investing cash flow often signals reinvestment, not distress.
What Is Investment-Cash Flow Sensitivity?
ICFS is the empirical relationship between a firm's capital expenditures and the cash flow it generates internally from operations. Researchers typically estimate it by regressing CAPEX (scaled by capital) against operating cash flow (also scaled by capital), then checking whether the coefficient is positive, negative, or nonlinear.
Positive vs. Negative ICFS
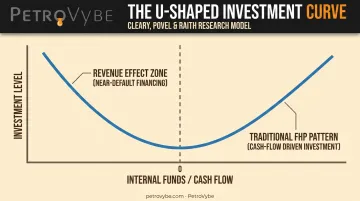
Under the traditional Fazzari-Hubbard-Petersen framework, positive ICFS signals financial constraint. Because external capital costs more than internal funds, constrained firms ramp investment up when cash flow is strong and pull back hard when it dries up.
But that's not the whole story. Cleary, Povel, and Raith documented a U-shaped investment curve: investment falls as internal funds shrink toward zero, then rises again once internal funds turn very low or negative. Their explanation is a "revenue effect" — near default, creditors capture enough of a project's upside that they'll accept a smaller promised repayment, making investment attractive even when cash is scarce.
This matters to outside stakeholders because ICFS acts as a proxy for how dependent a company is on capital markets and how resilient it is to a cash flow shock.
Calculating ICFS: A Simple Example
Researchers commonly split firms into terciles (low, middle, high cash flow) and run separate regressions, or use spline regressions to detect where the slope changes sign. A simplified illustration:
| Firm | Cash Flow Position | CAPEX Response | Sensitivity Type |
|---|---|---|---|
| Firm A | High cash flow | Rises $0.30 per $1.00 increase in operating cash flow | Positive (classic FHP pattern) |
| Firm B | Very low or negative cash flow | Rises again as cash flow falls further | Negative (revenue effect) |
| Firm C | Mid-range, near the breakpoint | Slope flattens before flipping sign | Inflection point spline models are built to detect |
The same company can show both patterns depending on which cash flow range it falls into during a given year, which is exactly why a single sensitivity number can mislead.
The Evidence: Is ICFS a Reliable Measure of Financial Constraints?
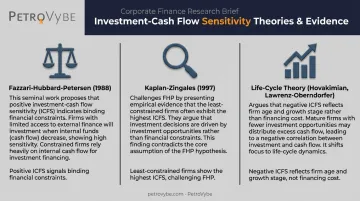
The debate began when Fazzari, Hubbard, and Petersen studied 422 U.S. manufacturing firms from 1970 to 1984 and found that low-dividend firms showed much stronger positive ICFS than high-dividend firms. Their interpretation: low-payout firms faced financing constraints, so their investment tracked internal funds closely.
Kaplan and Zingales revisited the same low-dividend firms and classified them by actual financial condition using annual reports. Their finding flipped the script: the least constrained firms in the sample showed the greatest ICFS. The conclusion was blunt: ICFS is not a valid, standalone measure of financing constraints.
The U-Shaped Investment Curve
Cleary, Povel, and Raith's revenue-effect theory explains one reason negative ICFS shows up empirically. Using Compustat data spanning 1981 to 1999 across tens of thousands of firm-year observations, they found investment bottoms out near zero internal funds and rises on either side of that trough. Financing costs, in other words, aren't monotonic in internal funds. They're U-shaped.
The Corporate Life-Cycle Alternative
A competing explanation has gained ground: negative ICFS reflects where a firm sits in its life cycle, not its financing costs. Hovakimian's 2009 research found that firms with negative ICFS had the lowest cash flow and the highest growth opportunities: a profile that fits newly public or young companies almost perfectly.
Lawrenz and Oberndorfer's 2023 study tested this directly against German SME data: 19,201 firms and 75,692 firm-year observations from 2007 to 2015, roughly 65% of which qualified as small or midsize businesses. The findings favored life-cycle dynamics over the revenue-effect theory:
- Negative ICFS was substantially stronger among young, small, high-growth firms
- Older, larger firms behaved as cash-flow insensitive
- The nonlinear pattern was far weaker in mature companies than in early-stage ones
The Role of Cash Flow Volatility
A separate mechanism comes from Mulier, Schoors, and Merlevede's research on unquoted European SMEs. They found firms with lower cash flow volatility display higher ICFS, because a cash flow shock carries more information about future expected cash flow when that cash flow is normally stable. High-volatility firms, by contrast, treat any single year's cash flow as noise.
Taken together, this evidence points to one conclusion: ICFS alone isn't a clean proxy for financial constraint. It needs to be read alongside firm age, size, debt levels, and cash flow volatility before drawing conclusions.
What If Investing Cash Flow Is Negative?
Two different things share confusingly similar names here, and they're easy to mix up.
| Term | What It Means |
|---|---|
| Negative ICFS coefficient | A statistical relationship from a regression, describing how investment moves relative to cash flow across many firms or years |
| Negative investing cash flow | A line item on a single company's cash flow statement, meaning CAPEX and acquisitions exceeded related inflows that year |
The second one is common, and often healthy, for growth-stage or capital-intensive companies. A firm actively deploying capital into new projects will show negative investing cash flow almost by definition. This fits the life-cycle pattern described above: low cash flow paired with high investment.
Rather than treating negative investing cash flow as an automatic red flag, evaluate it alongside:
- Operating cash flow trends: is the core business generating more cash over time?
- Financing sources: is the company raising capital on reasonable terms, or scrambling for it?
- What the capital is funding: new productive assets, or patching over losses?
4 Common Investment Appraisal Techniques
Cash flow sensitivity analysis pairs naturally with the four classic project-appraisal methods used to underwrite individual investments.
| Technique | What It Measures | Decision Rule |
|---|---|---|
| Net Present Value (NPV) | Discounted value of all project cash flows minus initial outlay | Accept if NPV > 0 |
| Internal Rate of Return (IRR) | The discount rate at which NPV equals zero | Accept if IRR exceeds required return |
| Payback Period | Time needed to recover the initial investment | Compare against management's cutoff |
| Profitability Index (PI) | Present value of inflows relative to initial outlay | Accept if PI > 1 (useful for capital rationing) |
This analysis complements these tools by stress-testing the revenue, cost, and timing assumptions feeding each calculation. A project can look attractive on paper at a base-case price deck and fall apart the moment commodity prices soften or completion costs run over.
In project-based industries like oil and gas development, these four techniques are applied at the individual well or project level, layered on top of decline-curve modeling and independently engineered reserve estimates. PetroVybe's own $48 million PV-09 reserve valuation, certified by an independent engineering firm, exemplifies this approach.
Applying These Insights to Oil & Gas Development Investing
Upstream energy developers are about as capital-intensive and life-cycle driven as businesses get. A young development-stage operator plowing cash back into new wells can produce investing cash flow patterns that look like textbook financial distress: heavy CAPEX, thin or negative free cash flow, without any actual financial weakness behind it.
That's exactly the trap the life-cycle research warns against. Sophisticated investors need to look past a single sensitivity coefficient toward three things instead:
- Reinvestment discipline: whether capital targets productive assets with a defined return threshold, not just gap-patching
- Third-party validation: whether an independent engineering firm has confirmed the reserves backing the investment thesis
- Operational track record: whether the team has a documented history of picking productive locations
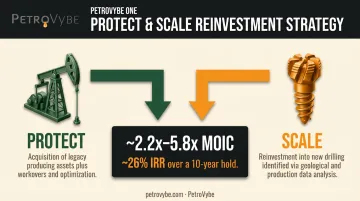
PetroVybe's reinvestment model, built around what it calls the PROTECT and SCALE strategy, illustrates this distinction well. The PROTECT side acquires legacy, already-producing assets and applies targeted workovers and optimization projects to extend their output.
The SCALE side reinvests operating cash flow into new drilling identified through geological and production data analysis. The goal is compounding Multiple on Invested Capital (MOIC) over a 10-year hold. PetroVybe projects a ~2.2x to 5.8x MOIC range and roughly 26% IRR over that window, though these figures remain forecasts dependent on commodity pricing and drilling outcomes.
Two risk mitigants matter here directly in the context of the cost-revenue literature discussed above. The first is independent reserve validation: PetroVybe's proved reserves carry a $48 million PV-10 valuation, determined by a licensed third-party engineering firm rather than management's own estimate.
The second is track record depth. Chief Geophysicist Michael Stamatedes brings a 75.2% well-success rate across a 48-year career, well above the sub-40% industry peer average, directly reducing the geological uncertainty that feeds decline-curve and EUR calculations.
There's also a financing-cost angle to consider. PetroVybe's Intangible Drilling Cost deduction structure delivered a 94% tax deduction against active income for 2024 partners and 91% for 2025 partners. Because that deduction offsets W-2 income and capital gains rather than only passive income, it effectively lowers investors' after-tax cost of capital funding the reinvestment cycle, which is directly relevant to how favorably a company's investment behavior reads relative to its cash flow.
Frequently Asked Questions
What are the 4 investment appraisal techniques?
The four classic techniques are Net Present Value (NPV), Internal Rate of Return (IRR), Payback Period, and Profitability Index (PI). Each evaluates project viability from a different angle, from discounted returns to capital recovery speed.
What if investing cash flow is negative?
This is common for growth-stage, capital-intensive firms actively reinvesting in new assets. Assess it alongside operating cash flow trends and financing sources rather than treating it as an automatic warning sign.
Is investment cash flow sensitivity a good measure of financial constraints?
The evidence is mixed. ICFS works best when combined with other indicators like firm age, size, debt levels, and cash flow volatility rather than used alone.
How is investment-cash flow sensitivity calculated?
Researchers typically regress capital expenditures against operating cash flow, often splitting the sample into terciles or using spline regressions to capture nonlinear, U-shaped patterns.
What causes investment-cash flow sensitivity to be negative?
Recent evidence favors corporate life-cycle dynamics, particularly young, high-growth, cash-poor firms, over pure financing-cost explanations rooted in default risk.
Does firm size or age affect investment-cash flow sensitivity?
Yes. Smaller, younger firms with strong growth opportunities show far more pronounced nonlinear ICFS than larger, mature companies, which tend to appear comparatively cash-flow insensitive.