
That gap is exactly what the asset turnover ratio reveals. Many investors focus on profit margins and miss this efficiency signal entirely, and that blind spot gets more expensive the further you move into asset-heavy industries.
This ratio is a core efficiency metric that investors and lenders use to judge how well a company converts its assets into revenue. It's especially critical in capital-intensive sectors like oil and gas, where drilling rigs, leasehold, and infrastructure sit on the books long before a single barrel gets sold.
Here's what you'll walk away with: the formula, a step-by-step calculation, what counts as "good," and how the concept applies to evaluating asset-heavy investments like natural gas development.
Key Takeaways
- Asset turnover ratio measures net sales generated per dollar of average total assets.
- There's no universal "good" number; benchmarks only apply within the same industry.
- Retail often exceeds 1.9x; utilities and upstream energy stay below 1.0x.
- In asset-heavy sectors like oil and gas, execution matters more than the raw ratio.
- Pairing this ratio with return on assets gives a fuller efficiency-plus-profitability picture.
What Is the Asset Turnover Ratio?
Asset turnover ratio is an efficiency, or activity, ratio. It measures how effectively a company uses its total assets to generate net sales. The higher the multiple, the more revenue a company squeezes out of every dollar tied up in assets.
This ratio also plays a starring role in DuPont analysis, a framework that breaks Return on Equity into three drivers: profit margin, asset turnover, and financial leverage. We'll unpack that connection in more detail later, but the short version is this: asset turnover isolates efficiency as its own lever, separate from pricing power or debt use.
Not every business needs to worry about this ratio equally.
Asset-heavy models, such as manufacturing, utilities, and oil and gas, carry large capital investments that sit on the balance sheet for years before generating full revenue potential. Asset-light models, such as software, consulting, and many service businesses, need minimal physical assets to produce sales.
Asset turnover matters far more for the first group. A software company with a handful of laptops and a cloud subscription doesn't need this ratio to prove it's efficient. A refinery or drilling operation does.
Who actually uses this number? Equity investors screening for capital discipline, lenders assessing collateral productivity, and management teams benchmarking internal performance all lean on it. It's a signal of capital allocation discipline, not just raw profitability.
Why It Matters Beyond the Balance Sheet
A company can look profitable on paper and still be inefficient with its assets. Strong margins can mask a bloated asset base that's dragging down returns. Asset turnover exposes that gap. Margin-focused metrics alone won't catch it. That's why analysts pair the two.
How to Calculate the Asset Turnover Ratio
The core formula is straightforward:
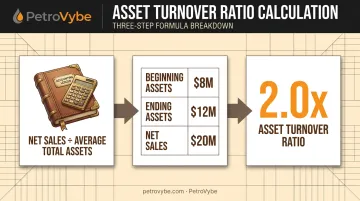
Asset Turnover Ratio = Net Sales ÷ Average Total Assets
Each input needs a quick definition: net sales is total revenue after returns, discounts, and allowances are subtracted, while average total assets is beginning total assets plus ending total assets, divided by two.
Why average instead of just the ending balance? Net sales is a flow measured across an entire period. Total assets is a point-in-time snapshot. Averaging the beginning and ending balances aligns the two, so a big year-end acquisition doesn't distort the ratio.
Worked example:
Say a company reports:
- Beginning total assets: $8 million
- Ending total assets: $12 million
- Net sales for the year: $20 million
Average total assets = ($8M + $12M) ÷ 2 = $10 million
Asset Turnover Ratio = $20M ÷ $10M = 2.0x
In plain terms, that company generated $2 in sales for every $1 tied up in assets. That baseline number becomes far more useful once you know whether it's measuring total assets or just fixed assets.
Total vs. fixed asset turnover: "Total" asset turnover includes everything on the balance sheet: cash, receivables, inventory, and property, plant, and equipment (PP&E). "Fixed" asset turnover isolates just the PP&E piece. We'll cover that variation in more depth further down, but keep the distinction in mind now.
Common Calculation Mistakes to Avoid
Three errors show up constantly:
- Using ending assets only instead of the average — this overstates efficiency after a big asset purchase or understates it after a disposal.
- Forgetting to net out returns and discounts from the sales figure, which inflates the ratio artificially.
- Comparing across mismatched fiscal periods, such as a company's Q4 trailing-twelve-months figure against a peer's calendar-year number.
What Is Considered a Good Asset Turnover Ratio?
There's no universal "good" score here. The ratio only means something when benchmarked against industry peers and tracked over time within the same company.
Asset-light sectors post structurally higher ratios than asset-heavy ones, and the gap isn't small:
| Sector | Aggregate Asset Turnover (TTM) |
|---|---|
| Retail | 1.93x |
| Oil and Gas Production | 0.55x |
| Electric Utilities | 0.24x |
Retail turns its assets nearly eight times faster than utilities. That gap reflects the nature of the business: utilities require massive fixed infrastructure before they ever bill a customer, not a management failing.
What does a ratio of 4 actually signal? For every $1 in assets, the company generates $4 in sales. That's very strong for most industries. But context matters: a ratio of 4 would be almost unheard of in oil and gas or utilities, and would warrant a second look rather than automatic celebration.
Extremes in either direction deserve scrutiny. Unusually high ratios can signal underinvestment in the asset base needed to sustain future growth, not just superior efficiency. Unusually low ratios can flag excess capacity, poor receivables collection, or sluggish inventory management.
Asset Turnover in Oil & Gas Development: A Different Yardstick
Upstream oil and gas is inherently capital-intensive. Drilling, leasehold acquisition, and infrastructure costs land on the balance sheet long before wells produce a dollar of revenue. Lower absolute ratios are structurally normal here, not a red flag.
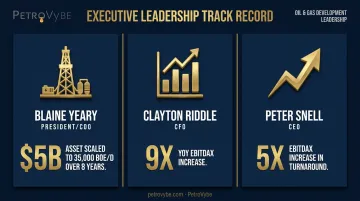
Within that reality, operational execution becomes the real differentiator. Take PetroVybe's leadership team:
- President and COO Blaine Yeary previously scaled a $5 billion asset from zero to 35,000 barrels of oil equivalent per day over eight years.
- CFO Clayton Riddle led a 9x year-over-year EBITDAX increase in a prior development role.
- Founder and CEO Peter Snell led a 5x EBITDAX increase in an oil and gas turnaround.
These track records suggest operators who extract more value per dollar of invested capital than sector averages imply, even inside a fundamentally asset-heavy business.
If you're an accredited investor evaluating a natural gas development opportunity, ask the operator for their production-per-dollar-invested trends. Headline reserve or acreage figures alone don't tell you how efficiently that capital converts to cash flow. Ask how a forecasted decline curve compares to nearby producing wells, and whether the projected return depends on an eventual exit or genuine operational cash flow.
Asset Turnover's Role in DuPont Analysis
DuPont analysis breaks Return on Equity into three multiplied components:
ROE = Net Profit Margin × Asset Turnover × Equity Multiplier
A company can lift ROE three different ways:
- Raise profit margins through pricing or cost control
- Use assets more efficiently (the asset turnover lever)
- Add financial leverage through debt
Asset turnover isolates the efficiency lever specifically. This matters because leverage can flatter ROE without any real operational improvement underneath it.
A quick illustration makes the mechanics clear:
| Metric | Value |
|---|---|
| Net Profit Margin | 29% |
| Asset Turnover | 0.53x |
| Equity Multiplier | 2.37x |
| Resulting ROE | ~36% |
Hold the margin and leverage steady, and any percentage gain in that 0.53x turnover figure produces the same percentage gain in ROE.
The catch: leverage without efficient asset use can backfire fast. A company that juices its equity multiplier while asset turnover stagnates isn't actually getting better. It's just carrying more risk to produce the same operating result. That's the exact distortion DuPont analysis is designed to catch.
Fixed Asset Turnover Ratio: A Key Variation
Fixed Asset Turnover = Net Sales ÷ Average Fixed Assets (PP&E)
This variation isolates capital expenditure efficiency rather than whole-balance-sheet efficiency. It strips out cash, receivables, and inventory to focus purely on how well property, plant, and equipment convert into sales.
Analysts reach for this version specifically in PP&E-heavy industries:
- Oil and gas
- Manufacturing
- Utilities
In these sectors, PP&E dominates the balance sheet, so total asset turnover can obscure what's really happening with the productive infrastructure itself.
Watch the trend, not just the snapshot. Rising fixed asset turnover over time typically signals a company maturing into its production capacity, with wells or facilities ramping toward full output.
A sudden drop doesn't always spell trouble. It can flag idle or underutilized infrastructure, but it can also simply reflect a recent capital investment that hasn't started producing yet. Depreciation, asset age, and disposal activity all move this number too, so compare only similar asset vintages.
Limitations and How to Improve Asset Turnover Ratio
This ratio has real blind spots worth knowing before you lean on it too heavily:
- It ignores profitability entirely. A company can post a strong ratio while losing money on every sale.
- One-time events distort it. A major asset sale or a large capex investment can swing the number without reflecting a real operational shift.
- It's not comparable across industries. A 0.6x ratio might be excellent in utilities and alarming in retail. Capital-intensive sectors like oil and gas exploration often post sub-1x ratios simply due to heavy upfront investment in wells and infrastructure.
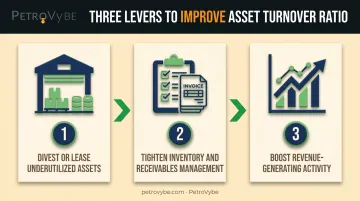
If your ratio is lagging peers, a few practical levers can help:
- Divest or lease underutilized assets that aren't contributing to revenue generation.
- Tighten inventory and receivables management to free up capital tied up in slow-moving stock or overdue invoices.
- Boost revenue-generating activity from the existing asset base before adding new capacity.
The smarter move is pairing asset turnover with a profitability ratio like return on assets. One tells you how efficiently assets generate sales; the other tells you whether those sales actually produce earnings. Together, they give a far more complete picture than either delivers alone.
Frequently Asked Questions
What is the asset turnover ratio formula?
The formula is Net Sales divided by Average Total Assets. Net sales reflects revenue after returns and discounts, while average total assets are the beginning and ending balance sheet figures divided by two.
What is considered a good asset turnover ratio?
There's no universal benchmark. Ratios must be compared within the same industry and tracked over time, since asset-light sectors like retail naturally run higher than asset-heavy sectors like utilities or oil and gas.
What does asset turnover ratio of 4 indicate?
It means the company generates $4 in sales for every $1 in assets, generally a sign of strong efficiency. Context still matters, since a ratio that high would be unusual in capital-intensive industries.
What is a bad or low asset turnover ratio?
Low ratios often point to excess capacity, weak inventory turnover, or underused fixed assets. What counts as "low," though, depends entirely on the industry you're comparing against.
How is asset turnover ratio different from fixed asset turnover ratio?
Total asset turnover uses every asset on the balance sheet in its calculation. Fixed asset turnover narrows the focus to property, plant, and equipment only, isolating capex efficiency.
Can an asset turnover ratio be too high?
Yes. An unusually high ratio compared to peers can signal underinvestment in the assets a company needs to sustain future growth, rather than pure operational excellence.