
Here's where things go sideways: many investors confuse how much risk they can stomach with how much risk they can actually afford. Those are two different questions, and answering only one of them leads to portfolios that look fine on paper but fall apart under real-world pressure.
This guide breaks down what risk level actually means, walks through the five standard risk tiers used by major institutions, explains what shapes your personal number, and looks at how alternative assets fit into the picture once you've moved past the traditional stock-and-bond spectrum.
Key Takeaways
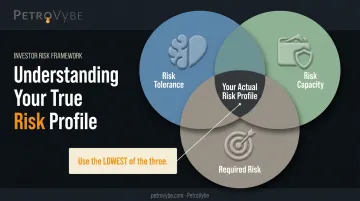
- Investment risk level blends three inputs: risk tolerance, risk capacity, and required risk
- Most frameworks define five risk tiers, from Conservative to Aggressive Growth, based mainly on stock-to-bond-to-cash splits
- Time horizon and liquidity needs drive most of the variation in how much risk an investor can reasonably take
- Sitting outside your appropriate risk range, too high or too low, can derail long-term goals
- Uncorrelated alternative assets can help manage portfolio risk beyond the standard public-market pyramid
What Investment Risk Level Represents
Investment risk level is the combined measure of volatility and potential loss an investor is willing, able, and required to accept in pursuit of returns. It's a profile built from three separate inputs, not one fixed personality trait, and all three need to be reconciled together; getting only one of them right isn't enough.
The CFA Institute's investment risk profiling framework puts it plainly: risk capacity sets the upper boundary on volatility an investor can take, while risk need can never exceed that financial ability, no matter how ambitious the goal. Low behavioral tolerance for losses can't be waved away, either.
Risk Tolerance: Your Emotional Comfort
Risk tolerance is the "sleep at night" test. It measures how much portfolio swing you can handle before panic-selling at the worst possible moment, and it's largely psychological rather than mathematical.
Unlike your bank balance, risk tolerance tends to stay fairly stable across a lifetime. Someone who white-knuckles a 15% drawdown at 30 will likely feel the same discomfort at 60, even if their financial situation looks completely different by then.
Risk Capacity: Your Financial Ability
Risk capacity is the objective side of the equation. It's your ability to absorb losses based on income, savings, existing debt, and time horizon, regardless of how you feel about volatility.
This number moves. Marriage, a job loss, a new mortgage, or retirement can all shift risk capacity overnight. That's why the Financial Planning Association's RiskPACK model treats debt ratios, income stability, and net worth as core capacity indicators that need regular reassessment.
Required Risk: What Your Goals Demand
Required risk, a concept popularized by firms like Edward Jones, asks a different question entirely: how much risk do you need to take to realistically hit a stated goal, given your timeline and current savings rate?
Here's the rule that ties all three together: use the lowest of the three numbers — tolerance, capacity, or requirement — to set your actual risk profile. If your goal requires aggressive growth but your capacity can't absorb a bad year, capacity wins. Full stop.
The 5 Levels of Investment Risk
No single "official" risk scale governs the industry, but institutional models from Schwab, Fidelity, and most robo-advisors converge on a similar five-tier structure. Each tier is differentiated mainly by how much of the portfolio sits in stocks versus bonds and cash.
| Risk Tier | Stocks | Bonds | Cash | Best Year | Avg Annual | Worst Year |
|---|---|---|---|---|---|---|
| Conservative | 20% | 50% | 30% | 22.9% | 7.1% | -10.9% |
| Moderately Conservative | 40% | 50% | 10% | 26.4% | 8.5% | -15.0% |
| Moderate | 60% | 35% | 5% | 30.9% | 9.5% | -22.8% |
| Growth | 80% | 15% | 5% | 34.7% | 10.3% | -30.5% |
| Aggressive Growth | 95% | 0% | 5% | 40.2% | 10.7% | -36.4% |
Data reflects Charles Schwab's hypothetical weighted index portfolios, rebalanced annually across 12-month periods from 1971 through October 2025. These are historical illustrations, not forecasts.
Conservative: The lowest tier, dominated by cash, Treasuries, and short-duration bonds. Minimal stock exposure. The goal is capital preservation, not growth.
Moderately Conservative: A step up in equity exposure, but still bond-and-cash heavy. Designed to dampen volatility while allowing modest upside.
Moderate (Balanced): A near-even split between stocks and fixed income. This tier tries to balance growth potential against volatility control, and it's often the default for investors who haven't been given a clearer picture of their real profile.
Growth: Stock-heavy allocations built for long-term growth. Investors here tolerate larger short-term swings, sometimes 30%+ drawdowns, in exchange for higher expected returns over time.
Aggressive Growth: Near-all-equity, sometimes with alternative assets layered in, with minimal defensive holdings. Suited only to long time horizons and genuinely high loss tolerance.
These tiers describe traditional stock-bond-cash portfolios. Private assets, like PetroVybe's direct working-interest partnerships in Texas natural gas development, sit outside this framework entirely, with risk driven by reserve engineering and production economics rather than market swings.
Notice the pattern: every step up in equity exposure buys roughly a percentage point of extra average return, but costs you a much deeper worst-year loss. That trade-off is the entire game.
Factors That Shape Your Personal Risk Level
Your risk tier isn't chosen in a vacuum. A handful of concrete factors determine where you should sit.
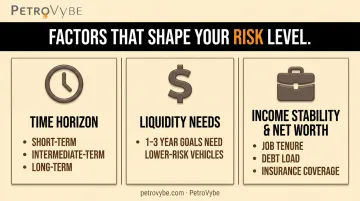
Time horizon is the leading driver. Longer horizons give a portfolio more time to recover from downturns. The Financial Planning Association generally groups timelines into three tiers when modeling allocation:
| Time Horizon | Classification |
|---|---|
| Under 3 years | Short-term |
| 4-7 years | Intermediate |
| Beyond 7 years | Long-term |
Liquidity needs matter just as much. Money you'll need within 1-3 years for goals like a house down payment or tuition bill should generally sit in lower-risk vehicles, regardless of your overall risk tolerance. FINRA's suitability rules list liquidity needs alongside age, income, and objectives as core factors advisors must weigh.
Income stability and net worth shape how much risk you can afford, not just how much you want. Considerations include:
- Job tenure and how predictable your income is
- Existing debt load relative to assets
- Total net worth outside the investment portfolio
- Insurance coverage that protects against catastrophic loss
Risk level isn't a "set it and forget it" number. A divorce, an inheritance, a layoff, or a market crash can all shift your real profile overnight. Reassessing after major life events matters more than any initial questionnaire ever could.
Diversifying Beyond the 5 Levels: Where Alternative Assets Fit
The traditional five-tier framework is built almost entirely around public market instruments: stocks, bonds, and cash. It says nothing about private, real, or tangible assets, which is a meaningful gap for investors who've maxed out what a standard 60/40 portfolio can offer.
Allocating a portion of a portfolio to non-correlated, tangible assets (think real estate, private equity, or natural resource development) can help manage overall portfolio risk, regardless of where you sit on the conservative-to-aggressive spectrum.
Family offices have leaned into this for years. UBS's 2025 Global Family Office Report found that alternatives now make up roughly 44% of the average family office portfolio.
This is where PetroVybe fits into the conversation. We're a Texas-based private natural gas development company giving accredited investors direct access to early-stage energy assets in Lavaca County and the broader Gulf Coast Basin. Rather than buying shares of an energy company on an exchange, partners hold a direct position in the physical production infrastructure itself.
What that looks like in practice:
- Direct equity participation through limited partnership units, with a $100,000 minimum investment
- Up to a 70% first-year intangible drilling cost (IDC) deduction against active income, including W-2 earnings and capital gains
- Tangible asset growth tied to natural gas liquids production, not stock market correlation
- Monthly passive distributions once production ramps, targeting a 10-year MOIC in the 2.2x-5.8x range
A necessary caution: alternative investments carry their own distinct risk profile. They're illiquid, require accreditation, and demand patience:
- Hold periods typically run 5-10 years, with little to no secondary market
- First distributions typically take 2-3 years to begin, per PetroVybe's own investor materials
- Full exits remain low-probability events, not a guaranteed liquidity path
Size any allocation according to your actual risk capacity, not just its tax advantages or projected returns.

Common Mistakes and Misconceptions About Risk Tolerance
Confusing tolerance with capacity. Feeling comfortable with volatility doesn't mean you can financially afford it, and vice versa. An investor with a high risk appetite but thin savings and unstable income is taking on more risk than their balance sheet can support.
Treating a questionnaire result as permanent. A risk score from five years ago doesn't account for the mortgage you took on or the child you're now putting through college, let alone the promotion that bumped you into a new tax bracket. Revisit it after any major life change, not just when your advisor sends a reminder email.
Assuming "safe" investments carry zero risk. Treasuries and cash equivalents protect against default risk, but they don't protect against inflation or opportunity cost.
Fidelity's analysis of long-term cash holdings found that $5,000 invested annually in cash from 1980-2023 grew to roughly $350,000. The same contributions invested in stocks grew to between $4.2 million and $5.5 million. That gap is the real cost of playing it "safe."
Frequently Asked Questions
What are the 5 levels of risk?
Conservative, Moderately Conservative, Moderate, Growth, and Aggressive Growth. Each tier increases equity exposure, shifting the stock-to-bond-and-cash split further toward growth as risk rises.
What is the 70/20/10 rule in investing?
It's typically a budgeting framework: 70% of after-tax income toward needs and spending, 20% toward savings and investments, and 10% toward debt repayment or giving. Treat it as a flexible guideline, not a rigid formula.
What's the difference between risk tolerance and risk capacity?
Risk tolerance is your emotional comfort with volatility. Risk capacity is your objective financial ability to absorb losses based on income, savings, and time horizon. They often don't match.
How often should I reassess my investment risk profile?
At minimum, annually. Reassess sooner after major life events like marriage, a job change, a new dependent, or retirement, since any of these can shift your real capacity fast.
What is considered a "safe" investment?
Government bonds, Treasury bills, and cash equivalents rank among the safest options because they carry minimal default risk. They still carry inflation risk and usually deliver lower long-term returns.
Can alternative investments like oil and gas help diversify my risk profile?
Yes, private tangible assets can offer non-correlated returns and tax advantages for accredited investors. They also come with illiquidity and longer hold periods, so size them appropriately within your broader risk strategy.