
Many readers struggle to pin down what "fair" even means when incomes vary so widely across a population. This guide breaks down the definition, the measurement tools economists actually use, the root causes of income disparity, and the policy levers governments pull to address it.
Along the way, we'll connect the dots to something practical: as redistribution policy evolves and tax burdens shift toward high earners, understanding these dynamics helps explain why proactive, tax-efficient wealth strategies matter more than ever.
Key Takeaways
- Equitable income distribution prioritizes fairness over strict equality, weighing effort, need, and circumstance
- The Gini Coefficient and Lorenz Curve quantify how income spreads across a population
- Governments pursue equity mainly through progressive taxation, transfer payments, and education access
- Rising tax burdens on high earners make personal tax-advantaged strategies increasingly relevant
What Is Equitable Income Distribution?
Equitable income distribution refers to the fair, socially justifiable allocation of income across a society. Notice the word "fair" instead of "equal." That distinction is intentional, and it's been argued about for centuries.
The concept traces back to the medieval notion of the "just price": an ethical standard for commercial exchange debated since antiquity. Merchants, scholars, and clergy argued over what constituted a fair transaction long before modern economics existed. The debate over fairness in income never really went away; it just changed vocabulary.
Equity vs. Equality: The Critical Difference
These two terms get used interchangeably, but they describe opposite philosophies:
- Equality means identical income for everyone, regardless of effort, skill, or circumstance
- Equity means fairness that may justify income differences based on contribution, need, or starting-point disadvantages
A surgeon and a warehouse worker earning the same salary would satisfy equality. Equity works differently: it might justify the surgeon earning more due to years of training, while also justifying targeted support for the warehouse worker who lacks access to affordable healthcare or education.
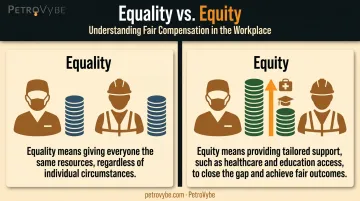
Equity asks a harder question than equality does: what allocation is actually justifiable, given people's different starting points?
Real-World Example of Equitable Distribution
Two examples make this concrete:
- Progressive taxation with transfer payments: higher earners pay a larger percentage in tax, funding unemployment benefits and subsidized healthcare for lower-income households. Nobody's income becomes identical, but resources shift toward those with greater need.
- Government-backed enterprise or education grants: programs that give unemployed individuals seed capital or training to start a business. This doesn't guarantee equal outcomes, but it gives people a genuine shot at building wealth.
Both examples share a theme: fairness through opportunity and need, not identical paychecks.
Why Equitable Income Distribution Matters
Equitable distribution carries measurable economic consequences that go well beyond its moral dimension.
Consumption and demand. Lower-income households spend a larger share of every additional dollar they receive than wealthy households do. A 2025 Federal Reserve analysis found that the bottom 80% of households by income spend roughly 7.5 cents of every added dollar of wealth, compared to just 0.8 cents for the top 20%. When gains concentrate at the top, aggregate spending in the economy tends to soften.
Social cohesion. Highly unequal societies face greater risk of unrest and political friction, which makes governing harder. Research using World Values Survey data across roughly 100 countries found that a 0.1 increase in the Gini coefficient associates with 4% to 8% higher political polarization. That's a correlation worth watching, not a guaranteed outcome. Institutions and trust still matter.
Human capital. Broader access to healthcare and education under a more equitable system tends to improve the overall quality of the workforce over time. A healthier, better-educated population produces more, innovates more, and pays more in taxes down the line.
The trade-off. Distributing income too evenly can dull incentives to work harder, innovate, or take entrepreneurial risk. Most economists favor equity over strict equality for this reason: fairness matters, but so does preserving the drive to build something new.
The practical implication: as governments lean harder on progressive taxation to fund redistribution, individuals, particularly high earners, face a growing tax burden. That reality is precisely why personal tax-efficient strategies deserve serious attention, a topic we'll return to shortly.
How Economists Measure Income Distribution
You can't manage what you can't measure. Economists rely on a handful of tools to quantify inequality.
The Gini Coefficient runs on a 0-to-1 scale (sometimes expressed as 0-to-100). Zero represents perfect equality; one represents perfect inequality, where a single person holds all the income. The further from zero, the more unequal the distribution.
Here's how three countries compare using the most recent World Bank figures:
| Country | Gini Coefficient (0–100) | Reference Year |
|---|---|---|
| Norway | 26.5 | 2023 |
| United States | 41.8 | 2024 |
| South Africa | 54.1 | 2022 |
These numbers come from the World Bank's Gini index data. Norway sits near the low-inequality end, the U.S. lands in the middle of developed economies, and South Africa illustrates what extreme concentration looks like. Note the different reference years — comparing across countries always requires checking the survey year and income definition.
Understanding the Lorenz Curve
The Lorenz Curve graphs cumulative population share against cumulative income share. Picture a diagonal line representing perfect equality: 20% of people hold 20% of income, 50% hold 50%, and so on.
The actual Lorenz Curve almost always bows below that diagonal. The bigger the gap between the curve and the line, the more unequal the distribution. In fact, the Gini Coefficient itself is calculated as the area between the Lorenz Curve and that 45-degree line, divided by the total area beneath it.
Income Shares by Decile and Quintile
Splitting a population into deciles (10 groups) or quintiles (5 groups) reveals how much income the richest and poorest slices actually collect.
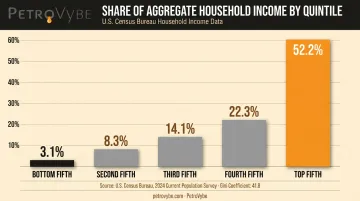
In the U.S., the Census Bureau's 2024 income report shows the highest household-income quintile receiving 52.2% of aggregate money income. That's more than half the country's total pre-tax cash income going to the top fifth of households. The bottom quintile received just 3.1%. That gap is exactly what a Gini score of 41.8 is trying to summarize in a single number.
Causes and Policy Solutions for Income Inequity
Why does income concentrate the way it does? Two forces drive most of it.
Unequal ownership of productive assets. Land, capital, labor, and entrepreneurship aren't distributed evenly, and asset ownership compounds over time.
Federal Reserve survey data shows the gap starkly: only about 34% of families in the bottom half by income own stock, compared to 95% in the top 10%. Among families who do own stock, the median holding in the top decile runs into the hundreds of thousands of dollars, dwarfing what bottom-half households hold.
Inherited wealth and unequal starting points. Not everyone begins from the same place. Inherited wealth, family connections, and unequally distributed inborn capabilities all persist across generations, regardless of individual effort.
Governments respond with two categories of tools:
Short-term fixes:
- Implementing progressive tax systems that scale rates with income
- Providing transfer payments such as unemployment benefits, disability support, and subsidies
- Establishing minimum wage laws that set income floors for workers
Long-run solutions:
- Expanding access to education and healthcare
- Creating jobs in underserved regions
- Reducing corruption so opportunity actually reaches citizens rather than getting captured by insiders
Taxes and transfers together do real work. The IMF's review of OECD countries found that combined tax-and-transfer policy lowered the average Gini from 0.43 (market income) to 0.29 (disposable income) — transfers doing more of the heavy lifting than taxes alone. Neither tool works well in isolation.
Building Personal Financial Equity Beyond Government Redistribution
Here's the practical reality: government redistribution mechanisms increasingly target high-income earners and capital gains to fund the programs described above. If you're a high earner, you can't just wait for policy to shake out in your favor. You need your own strategy to protect and grow what you've built.
This is where legal, tax-advantaged investment vehicles come into play — and it's a space we know well at PetroVybe.
How Natural Gas Development Creates Personal Tax Equity
PetroVybe structures its natural gas development projects, including its flagship PetroVybe ONE in Lavaca County, Texas, around Intangible Drilling Cost (IDC) deductions. Unlike most passive-income tax strategies, IDC deductions can offset a meaningful share of active income, including W-2 wages and capital gains, not just passive investment income.
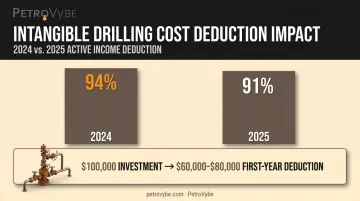
- In 2024, PetroVybe partners received a 94% tax deduction against active income
- In 2025, that figure stood at 91%
- A $100,000 investment can generate a $60,000 to $80,000 deduction in the first year alone
This matters because most real estate-style deductions get trapped by passive-loss rules unless you qualify as a full-time real estate professional. Oil and gas working interests operate under a different section of the tax code, which is why the deduction can reach further into your income statement.
Beyond the tax mechanics, PetroVybe frames this as a way individuals can build their own version of equity in their financial outcomes:
- Long-term legacy wealth through a 10-year hold structured around production growth
- Inflation-resistant passive income, with monthly distributions projected to peak above $10,000 per month during the production phase
- AI-driven electricity demand: natural gas already supplies roughly 42% of U.S. grid power, with data center needs projected to double by 2030
Redistribution policy will keep evolving. Building your own tax-efficient position, backed by tangible assets like proved natural gas reserves, is one way to stay ahead of it rather than reacting to it.
Frequently Asked Questions
What is equitable income distribution?
Equitable income distribution is the fair, though not necessarily equal, allocation of income across society based on need, effort, and circumstance. Unlike equality, it allows income differences that reflect genuine contribution or disadvantage.
What is the difference between equal and equitable distribution of income?
Equality means identical income for everyone regardless of effort or need. Equity means fairness that accounts for differing contributions, starting points, and circumstances. The result is often unequal, but justifiable, outcomes.
What is an example of equitable income distribution?
A progressive tax-and-transfer system is the classic example: higher earners pay a larger percentage of income, funding unemployment benefits, subsidized healthcare, or targeted grants for lower-income groups.
What is the Gini Coefficient and why does it matter?
The Gini Coefficient is a 0-to-1 (or 0-to-100) scale measuring income inequality, where 0 is perfect equality and 1 is perfect inequality. It lets economists compare inequality levels across countries and over time.
How does income inequality affect economic growth?
Lower-income households spend a larger share of each extra dollar, so concentrated income can soften aggregate demand. Highly unequal societies also face elevated risk of social and political instability.
What policies help achieve more equitable income distribution?
Progressive taxation, transfer payments like unemployment benefits, and long-term investment in education and healthcare access are the primary tools governments use to reduce income disparities.