
Most people have no idea where they land on this spectrum. They assume a high salary equals high net worth, or that owning a home automatically makes them "rich." Neither is true. This guide breaks down every major wealth category, the thresholds that define them, and the concrete steps that move a household from one tier to the next.
Key Takeaways
- Net worth (assets minus liabilities), not income, determines your wealth category
- The Federal Reserve's Survey of Consumer Finances splits U.S. households into five wealth tiers
- Age, liquid versus illiquid assets, and where you live all shift what "wealthy" actually means
- HNWI, VHNWI, and UHNWI labels are based on liquid investable assets, not total net worth
- Climbing tiers faster requires disciplined saving, debt reduction, and tax-advantaged investments
What Are Wealth Categories and Why Do They Matter?
What Is a Wealth Category?
Net worth follows a simple formula: Assets − Liabilities = Net Worth. Add up everything you own (cash, investments, home equity, retirement accounts), subtract everything you owe (mortgage, credit cards, loans), and the remainder is your true financial position.
Two quick examples:
- A household with $300,000 in home equity, $50,000 in a 401(k), and $20,000 in credit card debt has a $330,000 net worth
- Another earning $250,000 a year but carrying $200,000 in student loans and no savings might show a net worth near zero
Wealth categories are simply brackets economists and financial institutions use to group households by that net worth figure, allowing for benchmarking across age, region, and time.
They're distinct from income brackets or social class labels. A high earner isn't automatically high-net-worth, and a modest earner with decades of disciplined saving can outrank them.
Why Wealth Categories Matter in Personal Finance
Knowing your category gives you a realistic anchor for setting savings targets and structuring your asset allocation. Without it, two things tend to go wrong:
- Conflating income with wealth, leading to under-saving because "I make good money" feels like enough
- Over-concentrating net worth in one asset, most commonly a primary residence, leaving little liquidity for emergencies or opportunities
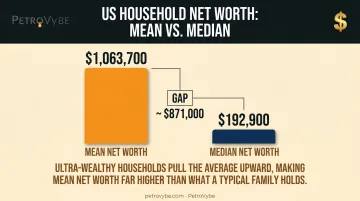
The scale of the problem is bigger than most assume. In the 2022 Survey of Consumer Finances, mean U.S. family net worth was $1,063,700, but the median was just $192,900 — a gap of nearly $871,000.
That gap exists because a small number of ultra-wealthy households pull the average sharply upward. For most people, the median is the far more honest benchmark.
The Different Wealth Categories Explained
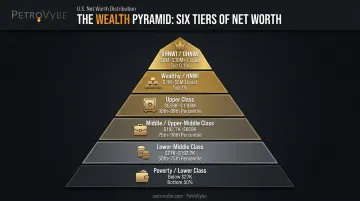
These tiers are built from 2022 SCF percentile data, though the "class" labels themselves are editorial, not official Federal Reserve terminology.
| Wealth Tier | Net Worth Range | Percentile |
|---|---|---|
| Poverty / Lower Class | Below $27,000 | Bottom 25% |
| Lower-Middle Class | $27,000 – $192,700 | 25th–50th |
| Middle / Upper-Middle Class | $192,700 – $659,000 | 50th–75th |
| Upper Class | $659,000 – $1,936,900 | 75th–90th |
| Wealthy / HNWI | $1M – $5M liquid assets | Industry-defined |
| VHNWI / UHNWI | $5M – $30M / $30M+ liquid | Industry-defined |
Poverty / Lower Class
Households in the bottom quartile have a median net worth of just $3,500, and the average actually dips into negative territory at -$5,300. Common traits include minimal or negative assets and heavy reliance on credit cards for everyday expenses. Access to investment vehicles like brokerage accounts is limited or nonexistent.
Lower-Middle Class
This bracket spans $27,000 to $192,700. Households here are often early-career savers or young families just starting retirement accounts. Home equity may exist but is thin, and an emergency expense can still wipe out most liquid savings.
Middle Class & Upper-Middle Class
Between the 50th and 75th percentile, net worth ranges from $192,700 to $659,000. This is where paid-down debt and home equity start compounding meaningfully. Employer retirement plans mature, and households typically hold a mix of home equity and modest investment accounts.
Upper Class
The 75th to 90th percentile covers $659,000 to $1,936,900 in net worth. There's a notable perception gap here: a 2025 Schwab survey found Americans believe it takes $2.3 million on average to be considered "wealthy" — well above where the actual upper-class threshold sits. Households at this level typically hold diversified investments and discretionary income, with growing exposure to private markets emerging as a hallmark of this bracket.
Wealthy / High-Net-Worth Individuals (HNWI)
Here the definition shifts. Industry classification, most notably from Capgemini's World Wealth Report, defines HNWI status by liquid investable assets of $1M to $5M, excluding the primary residence entirely. This measures something entirely different than total net worth percentiles. HNWIs typically gain access to private equity, hedge funds, and other alternative asset classes unavailable to retail investors.
Very-High and Ultra-High-Net-Worth Individuals (VHNWI/UHNWI)
- VHNWI: $5M–$30M in liquid investable assets
- UHNWI: $30M+ in liquid investable assets
At this level, households often establish family offices, gain direct access to institutional-grade deals, and wield outsized economic influence relative to their numbers. This is also where direct participation in early-stage energy or real asset development becomes accessible, opportunities historically reserved for institutions. PetroVybe, for instance, structures its natural gas development partnerships specifically for accredited investors in this bracket, pairing direct equity stakes with the tax advantages this income level typically seeks.
How to Determine Your Own Wealth Category
Calculating net worth sounds simple, but two mistakes throw off the number badly:
- Undercounted liabilities: people forget about auto loans, medical debt, or family loans
- Overvalued illiquid assets — a home's Zillow estimate isn't the same as cash you can deploy tomorrow
Once you have an accurate figure, compare it against Federal Reserve age-based benchmarks rather than the flat national median:
| Age Bracket | Median Net Worth |
|---|---|
| Under 35 | $39,000 |
| 35–44 | $135,600 |
| 45–54 | $247,200 |
| 55–64 | $364,500 |
| 65–74 | $409,900 |
| 75+ | $335,600 |
Matching your number to the right bracket only tells part of the story, though. Liquidity matters just as much as the total figure. A household with $700,000 net worth, but $600,000 of it locked in home equity, has far less financial flexibility than one with the same total split evenly between liquid investments and property.
Geography shifts the picture too. Federal Reserve data shows median net worth in metropolitan areas sits at $199,200, versus $146,400 in non-metro areas. What counts as "upper class" in rural Ohio looks very different from San Francisco or Manhattan.
How to Move Up the Wealth Ladder
Progress starts with tracking your net worth consistently, not just once a year at tax time. A quarterly check-in reveals whether debt paydown, savings, or investment growth is actually moving the needle.
Save Aggressively and Kill High-Interest Debt
Savings rate is the single biggest lever most households control directly. Vanguard's 2025 research found 43% of retirement plan participants contributed 15% or more of income toward retirement in 2024, a rate strongly associated with faster progression up the wealth ladder.
Pair that with targeted debt reduction:
- Debt avalanche: Pay off highest-interest debt first to minimize total interest paid
- Debt snowball: Pay off smallest balances first for psychological momentum
Either strategy works. What matters is picking one and sticking with it, since high-interest liabilities quietly erode net worth growth every month they linger.
Diversify Beyond Stocks, Bonds, and Real Estate
Once the basics are handled, accredited investors increasingly look past traditional portfolios into tax-advantaged alternative assets. This is where PetroVybe operates: a Texas-based natural gas development company that gives accredited investors direct equity participation in upstream energy projects through limited partnership units.
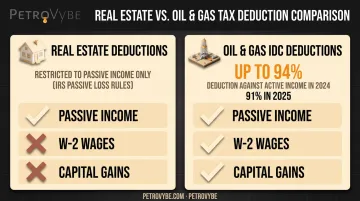
The appeal isn't just the tax code, though that's substantial. PetroVybe partners received up to 94% deductions against active income—including W-2 wages and capital gains—in 2024 through intangible drilling cost (IDC) deductions, with 2025 project structures delivering 91%.
Unlike real estate deductions, which are typically restricted to passive income under IRS passive loss rules, IDC deductions apply directly against active earnings. That's a structural advantage most alternative assets can't match.
This kind of diversification does two things at once:
- Reduces current tax liability, freeing up capital to reinvest
- Builds long-term passive income and tangible asset ownership outside the stock market
Reinvest and Let Compounding Work
The final accelerant is reinvesting passive income and capital gains rather than spending them. A household that reinvests distributions from alternative assets, dividends, or rental income compounds its net worth growth year over year, often moving between wealth tiers faster than salary increases alone could achieve.
Conclusion
Wealth categories exist on a spectrum, from poverty class through lower-middle, middle, upper, and eventually HNWI, VHNWI, and UHNWI territory, each defined by measurable net worth or liquid asset thresholds. Use these labels as a starting point for smarter decisions about saving, debt, and diversification.
Consistent saving, aggressive debt management, and strategic exposure to alternative investments move households up the ladder more reliably than any single lucky break. For accredited investors, that diversification can include direct-access opportunities like PetroVybe's oil and gas partnerships, which pair tax efficiency with long-term passive income.
Frequently Asked Questions
What are the 5 classes of wealth?
Federal Reserve percentile data breaks wealth into five tiers: bottom 25% (under $27,000), lower-middle (up to $192,700), middle/upper-middle (up to $659,000), upper class (up to $1.94 million), and wealthy/HNWI ($1 million+ in liquid assets).
How many Americans have a $1,000,000 net worth?
UBS data suggests roughly 8.9% of U.S. adults had total wealth above $1 million in 2022. That figure covers total net worth, not liquid investable assets specifically.
Is $30 million considered rich?
Yes. By industry standards like Capgemini and Knight Frank, $30 million in liquid or total net worth crosses into ultra-high-net-worth (UHNWI) territory, though lifestyle and location still shape how "rich" that feels.
What's the difference between net worth and income?
Income is cash flow earned annually through wages or business profit. Net worth is accumulated assets minus liabilities. A high income doesn't guarantee high net worth, and vice versa.
What net worth is considered upper class?
Federal Reserve data places the upper class between the 75th and 90th percentile, roughly $659,000 to $1.94 million. Public perception runs higher; a 2025 Schwab survey found Americans think it takes $2.3 million to feel "wealthy."
How can I move into a higher wealth category faster?
Increase your savings rate toward 15%+ of income, aggressively pay down high-interest debt, and diversify into tax-efficient alternative investments like accredited-investor energy development partnerships that offer deductions against active income.