
Introduction
Your portfolio drops 8% in a week because the Fed hints at another rate hike. AI stocks whipsaw on a single earnings call. Inflation data spikes, and suddenly every headline says sell.
The urge to react is normal, and most investors feel it.
The deeper problem is structural: if your wealth sits entirely in stocks, bonds, and real estate, you're fully exposed to every twist of the public market cycle. There's no buffer.
This guide breaks down how market cycles actually work, phase by phase, and what a disciplined wealth strategy looks like at each stage. We'll also cover a piece most portfolios overlook completely: true diversification into tangible, uncorrelated assets that don't rise and fall with the same headlines.
Key Takeaways
- Four phases drive market cycles: accumulation, expansion, distribution, contraction
- Adjust strategy by market phase and policy signals, not emotional reactions to headlines
- Diversify beyond stocks and bonds with tangible assets like natural resources
- Tax-advantaged investments help preserve and compound wealth at any point in the cycle
What Are Market Cycles? The Four Phases Explained
A market cycle is the recurring pattern of expansion and contraction in economic activity and asset prices. It's shaped by interest rates, corporate earnings, and investor sentiment moving together, then apart.
Here's the honest truth: there's no fixed clock. According to the National Bureau of Economic Research, U.S. business-cycle expansions averaged 64.2 months between 1945 and 2020, while contractions averaged just 10.3 months. Fiscal and monetary policy can stretch or compress these windows considerably. Anyone promising you a precise timeline is guessing.
The Four Stages of a Market Cycle
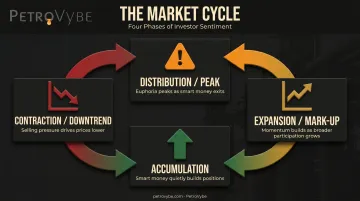
- Accumulation: Informed investors start buying near the bottom while broad sentiment is still pessimistic. Prices have stopped falling, but headlines haven't caught up.
- Expansion (mark-up): Prices trend higher, GDP grows, and unemployment falls. This is typically the longest phase — the mid-cycle grind where most wealth compounds.
- Distribution (peak): Sellers start dominating as valuations stretch. Optimism often peaks right before the reversal begins.
- Contraction (downtrend): Prices decline, unemployment rises, and capital preservation becomes the priority.
Why Identifying the Current Phase Is So Hard
Analysts lean on a dashboard of signals rather than any single indicator:
| Indicator | What it shows | Limitation |
|---|---|---|
| GDP/GDI data | Broad economic output and income trends | Revised frequently; lags real-time conditions |
| Yield curve | Recession probability via rate spreads | A leading signal, not an exact turning-point date |
| Corporate earnings | Profit momentum by cycle stage | Prices often move before earnings confirm the shift |
Even with all three, phase identification is largely retrospective. You usually know which phase you were in only after it's over.
What Drives Market Cycle Shifts
Cycle transitions rarely happen in a vacuum, and three forces tend to trigger them.
Macroeconomic policy is the biggest lever. The Federal Reserve raised its target rate from 0.25%–0.50% in March 2022 to 5.25%–5.50% by July 2023, a 500-basis-point swing in under 18 months driven by persistently elevated inflation, according to the Federal Reserve.
That kind of move doesn't just nudge markets. It reshapes borrowing costs, valuations, and risk appetite across every asset class.
Investor psychology amplifies whatever fundamentals are already doing. Fear and greed push prices further than earnings or GDP data alone would justify. This is why sentiment indicators, while imperfect, still carry predictive weight in short-term return forecasts.
Structural regime changes are different animals entirely. A rate environment shift is cyclical, but AI-driven electricity demand is not.
Natural gas already supplies nearly half of U.S. electricity generation, and that dependency is deepening, not because of a market cycle, but because data centers need power regardless of what the S&P does next quarter.
Confusing a structural shift with cyclical noise is one of the costliest mistakes a wealth strategy can make.
Wealth Management Strategies for Each Phase of the Cycle
Investors who thrive across cycles share one trait: a documented, policy-driven strategy instead of a gut reaction to the morning's headlines.
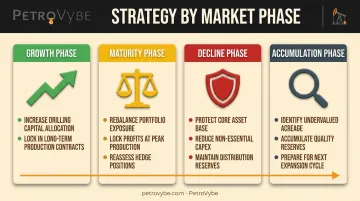
Expansion Phase Strategy
Lean into growth-oriented assets and cyclical sectors while the tailwind is strongest. The plan lets winners run without abandoning diversification, so you're not left chasing every hot sector that appears.
Peak Phase Strategy
This is where discipline gets tested, as valuations climb further ahead of earnings growth:
- Rebalance overweight positions back to target allocations
- Trim exposure to assets that have run furthest ahead of fundamentals
- Build liquidity reserves ahead of a potential downturn
Contraction Phase Strategy
Shift toward defensive assets, quality dividend payers, and non-correlated tangible holdings. Direct investments in producing oil and gas wells are one example: cash flow depends on commodity production, not stock market sentiment. But be clear-eyed about what "defensive" actually means: in 2022, S&P 500 Consumer Staples returned -0.62% while the broader S&P 500 fell -18.11% (S&P Global). That's meaningful relative protection, but it's still a loss.
Recovery (Accumulation) Phase Strategy
Identify undervalued opportunities in sectors with resilient long-term demand while sentiment is still shaky. Dollar-cost averaging back into growth positions removes the pressure of picking the exact bottom, which nobody does consistently.
Beyond Stocks and Bonds: Reducing Cycle Risk With Tangible Asset Diversification
Here's the uncomfortable reality most portfolios ignore: stocks and bonds don't always move in opposite directions. In 2022, the S&P 500 fell approximately 18.1% while the Bloomberg U.S. Aggregate Bond Index dropped roughly 13.0%. A standard 60/40 portfolio still lost about 16.1%. The bonds didn't offset the stocks. They fell together.
That's the limitation of a traditional two-asset portfolio. It works until the year it doesn't.
Tangible, real assets (real estate, commodities, natural resources) have historically shown lower correlation to public market swings, simply because their value is driven by different fundamentals: supply, demand, and physical scarcity, not quarterly earnings calls.
Natural Gas: A Structural Demand Story, Not a Sentiment Cycle
Natural gas development sits in an interesting spot right now. AI data centers are projected to add 3 to 6 Bcf/d of U.S. natural gas demand by 2030, according to a 2024 S&P Global Ratings analysis. That demand isn't cyclical. Data centers don't pull back because the Fed raised rates or because the market entered a distribution phase. They need power, no matter what.
For investors, this decouples natural gas returns from the same macro triggers that move stock and bond prices together. A recession that hits equity markets doesn't reduce a data center's electricity draw. That structural disconnect is exactly what a cycle-resistant portfolio needs. This is the dynamic PetroVybe is positioned around: natural gas development timed to the AI-driven electricity buildout, not to Wall Street's next earnings season.
Tax-Advantaged Structures Most Portfolios Never Touch
Beyond the diversification angle, natural gas development carries a tax mechanism most stock and real estate portfolios can't access: Intangible Drilling Cost (IDC) deductions. Unlike real estate depreciation, which is generally trapped by passive-loss rules unless you're a full-time real estate professional, IDC deductions can offset active W-2 income and capital gains directly.
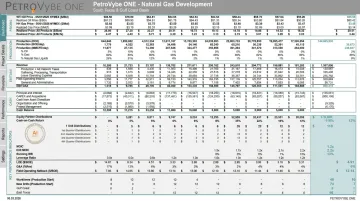
This is where PetroVybe fits into the picture. Accredited investors can take direct, passive positions in natural gas development projects across South Texas and the Gulf Coast Basin through PetroVybe ONE. A few specifics:
- Minimum investment: $100,000 per unit, accredited investors only
- 2024 partners received a 94% tax deduction against active income; 2025 partners received 91%
- IDC deductions typically represent 60–80% of invested capital, taken via K-1 either fully in year one or spread over five years
- 10-year targets of roughly 2.2x–5.8x MOIC and 26% IRR, paired with monthly passive distributions projected to peak above $10,000/month during production
- Reserves backed by a $48 million PV-9 valuation from an independent third-party engineering firm
The tax deduction isn't the main draw. This kind of investment compounds independent of stock market timing. It's passive by design, meaning no pressure to trade, rebalance, or react during volatile phases. You're not trying to time anything.
Common Mistakes Investors Make During Market Cycles
Most cycle-related losses stem from predictable investor behavior, not bad luck.
- Overreacting to headlines instead of following a documented plan. DALBAR's 2024 data shows the average equity investor earned 16.54% versus the S&P 500's 25.02%, a 848-basis-point gap from selling low and buying back late (DALBAR).
- Concentrating too heavily in one sector or asset class. A portfolio loaded up on tech during expansion looks great until distribution hits, when that same concentration becomes the biggest risk.
- Trying to perfectly time the market instead of following rules-based rebalancing. Nobody consistently calls the top or the bottom, and investor timing-gap data proves that repeatedly.
Frequently Asked Questions
What are the 4 stages of the stock market cycle?
The four stages are:
- Accumulation: Buying near the bottom, before the broader market notices
- Expansion (mark-up): Rising prices and broadening growth
- Distribution (peak): Sellers dominate as valuations stretch
- Contraction (downtrend): Declining prices and capital preservation
What market cycle are we in right now?
Determining this requires checking current GDP growth, unemployment trends, and the yield curve. Phase identification is inherently retrospective — you typically confirm a phase only after it has already shifted.
What is the market cycle strategy?
It means adjusting asset allocation by phase: growth-focused in expansion, defensive in contraction, while sticking to a documented, rebalancing-driven plan rather than reacting emotionally to news.
How long does a market cycle typically last?
Business-cycle data from the National Bureau of Economic Research shows expansions averaging 64.2 months and contractions averaging 10.3 months, though fiscal and monetary policy can extend or compress these considerably.
How can I protect my portfolio during a market downturn?
Diversify into non-correlated, tangible assets, maintain a liquidity reserve, and avoid emotional selling. A predetermined rebalancing plan does more to protect capital than reactive trading.
What is the difference between a market cycle and a regime change?
A market cycle is a short-term, recurring fluctuation in prices and sentiment. A regime change is a durable structural shift, like a long-term change in interest rate policy or a permanent rise in energy demand.