
That distinction matters more than most investors realize. A manufacturer can post healthy margins while sitting on a warehouse full of unsold inventory. A utility can look profitable on paper while tying up billions in fixed assets that barely turn over. Many investors evaluate return potential without ever checking whether a company — or an entire sector like energy, manufacturing, or real estate — is actually putting its assets to work.
Globally, that inefficiency adds up. PwC's 2023/24 Working Capital Study found roughly €1.5 trillion in excess working capital sitting idle across 17,000 corporations worldwide.
This guide breaks down what asset management ratios are, how to calculate the core formulas, and how to interpret them so you can make sharper financial and investment decisions.
Key Takeaways
- Asset management ratios (also called turnover ratios) show how efficiently a company converts assets into sales or cash
- Core ratios include inventory, receivables, payables, fixed asset, and total asset turnover
- Higher turnover typically signals efficiency, but benchmark against industry norms first
- Investors, lenders, and managers rely on these ratios to assess performance and capital discipline
What Are Asset Management Ratios?
Asset management ratios compare a company's revenue or cost of sales to its underlying asset base. They answer one specific question: how effectively is this business using what it owns to generate sales?
Financial analysts use them across several contexts:
- Corporate financial analysis: tracking operational health quarter over quarter
- Credit and lending decisions: gauging how quickly a borrower converts assets to cash
- Investment due diligence: comparing operational quality between competitors
- Internal operations management: spotting inefficiencies before they hit the balance sheet
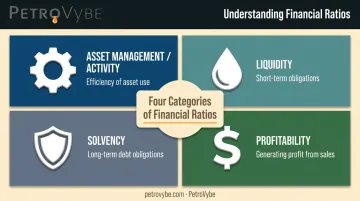
It's easy to confuse these with other ratio categories, so here's how they differ. The CFA Institute classifies them as a distinct category from liquidity, solvency, and profitability metrics, and each ratio family answers a different question about the business.
| Ratio Category | What It Measures |
|---|---|
| Asset management (activity) | Efficiency of asset use |
| Liquidity | Ability to meet short-term obligations |
| Solvency | Ability to meet long-term debt obligations |
| Profitability | Ability to generate profit from sales |
Most asset management ratios come in two formats: turnover ratios (how many times an asset "turns over" per period) and day-based ratios (average days outstanding, like DIO, DSO, or DPO). Both formats measure the same underlying efficiency; they just express it differently.
Why Asset Management Ratios Matter
These ratios connect directly to cash flow health, working capital needs, and a company's ability to fund growth without piling on debt. A business that collects receivables faster or moves inventory quicker needs less outside financing to operate.
The evidence backs this up. When McKinsey studied Alcoa's working capital cycle, it found the company shortened its cash conversion cycle by 23 days. That shift unlocked $1.4 billion in cash that no longer sat trapped in inventory and unpaid invoices.
Asset management ratios also:
- Improve decision quality for creditors and investors evaluating risk
- Reduce uncertainty around a firm's true operational health
- Reveal hidden inefficiencies, such as excess inventory or slow collections
- Support benchmarking against direct competitors
- Enable data-backed capital allocation decisions
Key Asset Management Ratios & How to Calculate Them
Each ratio below follows the same basic logic: divide a revenue or cost figure by the related asset. Here's what "good" and "bad" typically look like for each one.
Inventory Turnover & Days Inventory Outstanding (DIO)
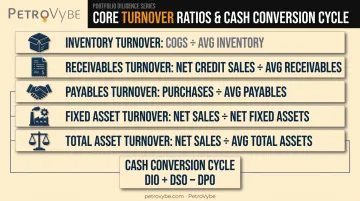
Formula: Cost of Goods Sold ÷ Average Inventory
DIO converts that turnover figure into days: 365 ÷ Inventory Turnover. This tells you how long inventory sits on the shelf before it sells.
High turnover generally signals strong sales and inventory management. But context matters. Abnormally high turnover can point to stockouts and lost sales, while unusually low turnover often signals obsolete or slow-moving inventory tying up cash.
Accounts Receivable Turnover & Days Sales Outstanding (DSO)
Formula: Net Credit Sales ÷ Average Receivables
DSO (365 ÷ Receivables Turnover) shows the average number of days it takes to collect payment after a sale. A rising DSO is often an early warning sign: it can signal weakening credit controls internally or financially stressed customers externally. Either way, it directly squeezes cash flow.
Accounts Payable Turnover & Days Payable Outstanding (DPO)
Formula: Purchases ÷ Average Trade Payables
DPO (365 ÷ Payables Turnover) reveals how a company manages payment timing to its own suppliers. Stretching payables can free up cash short-term, but pushing it too far risks straining supplier relationships and losing early-payment discounts.
Fixed Asset Turnover
Formula: Net Sales ÷ Net Fixed Assets
This ratio matters most in capital-intensive industries such as energy, manufacturing, and infrastructure, where large investments in property, plant, and equipment are simply the cost of doing business. Corporate Finance Institute notes that low fixed asset turnover is common and expected in these sectors, and that no single ratio number defines "efficient." Comparisons only mean something against industry averages or the company's own historical trend.
Total Asset Turnover
Formula: Net Sales ÷ Average Total Assets
Unlike fixed asset turnover, this measures efficiency across the entire balance sheet: working capital, fixed assets, everything. It's the broadest efficiency measure available, though its breadth makes it less diagnostic on its own. A weak total asset turnover figure tells you something's off; it doesn't tell you what.
Cash Conversion Cycle (CCC)
Formula: DIO + DSO − DPO
CCC combines the previous three ratios into a single number: how many days cash stays tied up in operations before it converts back into cash in hand. A shorter cycle generally means a business needs less outside financing to fund its day-to-day operations.
How to Interpret & Analyze Asset Management Ratios
Calculating the ratio is just the first step. The real value comes from interpreting the results in context by comparing them against industry benchmarks and historical trends.
Gather Accurate Financial Data. Pull consistent figures from the balance sheet and income statement for the same reporting period. Mixing quarterly income data with year-end balance sheet figures will produce misleading results.
Calculate the Relevant Ratios. Apply the correct formulas consistently over time. For example, switching between net credit sales and total revenue for receivables turnover will distort your trend analysis.
Benchmark Against Industry & History. Compare results to sector averages and the company's own multi-year trend. A capital-intensive business will naturally have lower turnover than an asset-light service company; context is crucial.
Turn Insights Into Action. A dropping receivables turnover combined with climbing inventory turnover suggests customers are not paying on time. This is a potential cash crunch worth investigating immediately.
To ensure your analysis is sound, avoid these common mistakes:
- Comparing ratios across unrelated industries (retail vs. utilities, for instance)
- Ignoring seasonality when reading quarter-to-quarter swings
- Treating one good or bad quarter as a permanent trend
Avoiding these pitfalls helps turn raw numbers into useful insight.
How PetroVybe Applies Asset Efficiency Discipline to Natural Gas Development
The principles above aren't just academic. They show up in how disciplined operators actually run capital-intensive businesses, including natural gas development, one of the most asset-heavy sectors that exists.
At PetroVybe, CFO Clayton Riddle brings a dual background as both a petroleum engineer and financial strategist. That combination matters because capital efficiency in oil and gas requires evaluating both sides at once: is the well engineered to produce, and does the return justify the capital deployed?
Riddle's track record reflects that dual lens:
- Managed capital development programs on assets exceeding $1 billion at Sheridan Production Company
- Advised on more than 70 upstream and midstream acquisitions at Odyssey Energy
PetroVybe also mirrors a core principle from ratio analysis itself: never rely solely on internal projections. Every project undergoes independent, third-party engineering review, including a PV-09 proved reserves valuation of $48 million across its South Texas and Gulf Coast Basin holdings. That's the same "benchmark against independent data" discipline that separates a credible ratio analysis from a misleading one.

The company's operating strategy, protecting legacy production while scaling new drilling through reinvested cash flow, reflects the same asset-utilization thinking investors apply when reading turnover ratios anywhere else.
For accredited investors applying this same scrutiny beyond public equities, PetroVybe's natural gas development opportunities offer a tangible, asset-backed alternative to traditional stock analysis, combining tax-advantaged structures with transparent, independently verified reporting on how efficiently capital is actually being deployed.
Conclusion
Asset management ratios show how efficiently a company turns its assets into cash and revenue, whether that company is a manufacturer, a retailer, or an energy developer. A single quarter's numbers rarely tell the whole story, though.
Review these ratios regularly, benchmark them against industry norms and historical trends, and treat them as one tool among several for sound financial and investment decisions.
Frequently Asked Questions
What are the key asset management ratios?
The core ratios are inventory turnover, receivables turnover, payables turnover, fixed asset turnover, and total asset turnover. Together, they measure how efficiently a company uses its assets to generate sales.
How do you calculate asset management ratios?
Each ratio divides a revenue or cost figure, like sales or COGS, by a related asset, such as inventory or receivables. Results are often converted into "days" for easier interpretation.
What is considered a good asset management ratio?
There's no universal number. "Good" depends entirely on industry norms and the company's own historical trend, since capital-intensive sectors naturally run lower turnover than asset-light ones.
What is the difference between asset management ratios and liquidity ratios?
Asset management ratios measure how efficiently a company uses its assets, while liquidity ratios measure whether it can pay its short-term obligations. They answer different questions entirely.
Why is inventory turnover important in asset management analysis?
It reveals whether inventory is moving efficiently or tying up excess capital. Slow turnover risks obsolescence, while unusually fast turnover can signal stockouts and lost sales.
How do investors use asset management ratios to evaluate opportunities?
Investors use these ratios to gauge management's operational efficiency and capital discipline before committing funds. The same scrutiny applies to public equities and private, asset-backed ventures, including direct energy development partnerships.