The stakes are real: Lower 48 oil output from wells online in 2023 or earlier fell from 4.3 million to 6.7 million barrels per day during 2024 alone, according to the EIA's analysis of legacy well decline. That's base decline, not mismanagement — but it's exactly the gap asset optimization exists to close.
This guide defines asset optimization, breaks down the strategies operators use to fight decline and protect margins, and covers the KPIs that prove it's working — with examples pulled from real oil & gas development.
Key Takeaways
- Asset optimization boosts performance and lifespan of assets already in service, not new acquisitions
- It's the subset of asset management focused on operating performance, not asset acquisition itself
- Core techniques include predictive monitoring, production optimization, data centralization, and criticality-based spending
- Success shows in BOEPD trends, LOE per BOE, uptime, and ultimately EBITDAX, MOIC, and IRR
What Is Asset Optimization?
Asset optimization is the discipline of extracting maximum value from assets an organization already owns by balancing performance, availability, and cost. Keeping equipment running isn't enough. The real objective is peak efficiency at the lowest cost per barrel produced.
For producing wells, pump jacks, compressors, and pipelines, that means continuously combining operational data, maintenance history, and market context to decide when and where to intervene. A well producing steadily but well below its type curve isn't "fine" just because it hasn't failed.
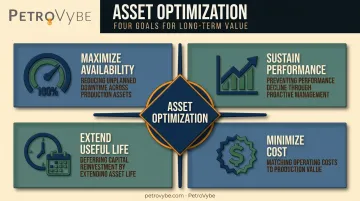
The Four Goals Optimization Pursues
- Maximize availability — reducing unplanned downtime from equipment failure or pipeline interruptions
- Sustain performance — catching production decline or inefficiency before it compounds into lost output
- Extend useful life — keeping wells and equipment within design parameters to defer costly capital replacement
- Minimize cost — matching maintenance and workover spend to each asset's actual production value
In capital-intensive sectors like oil & gas, this matters more than almost anywhere else. A single well or piece of midstream infrastructure can represent a significant upfront investment, and every point of inefficiency compresses the return an investor eventually sees.
The market underscores those stakes. The upstream digital-oilfield sector, the software and hardware layer supporting this kind of optimization, was valued at $30.12 billion in 2023 and is projected to reach $43.05 billion by 2029, a 6.3% CAGR, according to MarketsandMarkets' 2024 digital oilfield study. Operators invest in this technology because the alternative is watching cash flow quietly leak away.
Asset Optimization vs. Asset Management
Asset management is the umbrella discipline. It governs assets from acquisition and development planning through production and eventual plugging or disposal. Asset optimization lives inside that framework, focused specifically on maximizing the performance of assets that are already producing.
Think of it this way: asset management decides which wells to drill or acquire and how the portfolio should be structured. Asset optimization decides how hard each existing well should be pushed, when it needs a workover, and whether the lift configuration still makes sense.
| Dimension | Asset Management | Asset Optimization |
|---|---|---|
| Focus | Portfolio strategy, capital allocation, reserves | Well-level and facility-level performance |
| Time Horizon | Exploration through abandonment | Daily surveillance through multi-year mature-field management |
| Primary Goal | Realize lifecycle value while managing risk | Improve flow, uptime, and cost efficiency now |
| Key Tools | Reserve reports, development plans, M&A analysis | Condition monitoring, artificial lift tuning, workovers |
| Output | Acquisition/development decisions, plugging plans | Production uplift, lower LOE, extended run life |
The two reinforce each other. A strong asset management strategy sets the framework for which assets to acquire and develop, while day-to-day asset optimization determines whether those investments actually deliver the returns projected.
Get the acquisition wrong, and no amount of optimization saves the economics. Get the acquisition right but neglect optimization, and you leave production (and investor returns) on the table.
Key Strategies and Techniques for Asset Optimization
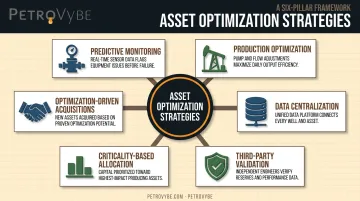
So what does asset optimization actually look like in practice? Six techniques consistently show up across the industry, each targeting a different lever of performance or cost.
Predictive and Condition-Based Monitoring
Tracking real-time data from wellheads, pumps, and compressors flags developing issues before they cause failure or downtime. Results vary by case. A Kazakhstan ESP deployment that paired new hardware with real-time monitoring cut downtime by 27% and extended pump run life from single digits of days to 122 days, per SLB's case study on ESP optimization. McKinsey separately estimates predictive maintenance can reduce unplanned downtime 20-30% across offshore and surface equipment.
Reservoir and Production Optimization
Artificial lift adjustments, choke management, and targeted workovers restore or sustain production from existing wells, often more cost-effectively than new drilling. Published field results range widely, from a 2.2% uplift across more than 1,300 wells in one automated gas-lift program to 12% on a single well in another. The range itself is the lesson: results are asset-specific, not a universal formula.
Data Centralization and Asset Intelligence
Consolidating production data, maintenance logs, and financial performance into a single system speeds up decisions across a portfolio of wells. At PetroVybe, this function sits with a dedicated VP of Asset Intelligence & Performance, whose role is translating raw field data into decisions that protect and grow output across the portfolio rather than reacting well by well.
Criticality-Based Resource Allocation
Not every well deserves the same attention. Ranking assets by production value and failure risk directs maintenance dollars and workover crews where they generate the greatest return, instead of spreading capital evenly across a portfolio where a handful of wells drive most of the cash flow.
Optimization-Driven Acquisitions
Some of the biggest value creation comes from buying underperforming or overlooked assets and applying workovers, recompletions, or operational improvements after closing. PetroVybe's portfolio includes a project that saw a 21x fair market value increase, a result consistent with its broader approach of acquiring legacy production and layering targeted intervention on top, rather than betting solely on new drilling outcomes.
Third-Party Engineering Validation
Independent reserve and performance reviews confirm that optimization efforts are translating into real, defensible value, not just operational activity. PetroVybe's $48MM proved reserves valuation (PV-09), determined by a licensed third-party engineering firm, is the kind of external validation that separates a genuinely optimized asset base from one that just looks good on an internal spreadsheet.
How to Measure Asset Optimization Success: Key KPIs
Strategies only matter if they show up in the numbers. Here's what to actually track.
| KPI | What It Measures | Why It Matters |
|---|---|---|
| Production rate (BOEPD) | Barrels of oil equivalent produced per day | Frontline signal that output is holding or growing |
| LOE per BOE | Operating cost divided by production volume | Shows whether optimization is lowering cost per barrel |
| Uptime/availability | % of scheduled time an asset actually produces | Captures both planned and unplanned downtime losses |
| Actual vs. decline curve | Real output compared to forecasted decline | Flags underperformance early, before it compounds |
| EBITDAX growth | Operating profitability, adjusted for exploration expense | Bottom-line proof optimization is compounding into profit |
| MOIC and IRR | Return multiple and annualized rate of return | Where well-level optimization ultimately lands for investors |
Lease Operating Expense per BOE is worth watching closely. EY reported average 2023 production costs of $11.73 per BOE across 50 large public U.S. E&P companies — a useful peer comparator, though not a universal target, since commodity mix and company size shift the number significantly.
Uptime needs a clear definition before you trust the figure. Specify whether you're measuring equipment runtime or full production efficiency (actual output over maximum potential), and whether planned maintenance counts against the number.
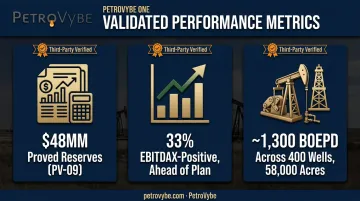
These same KPIs show up directly in PetroVybe's own field results. At the portfolio level, the company tracks 33% EBITDAX-positive operations, 33% ahead of its most recent quarterly plan, a signal that workovers, cost discipline, and production gains are compounding rather than just offsetting decline.
That performance sits on a base of roughly 1,300 BOEPD across 400 producing wells and 58,000 acres — the kind of trend line that eventually rolls up into investor-facing returns.
Asset Optimization in Oil & Gas Development: The PetroVybe Approach
PetroVybe's operating philosophy centers on protecting legacy production while compounding output over time — a framework the company calls PROTECT and SCALE. Rather than betting the entire strategy on new drilling outcomes, the company splits execution into two functions.
PROTECT acquires legacy production assets and applies targeted workovers to enhance performance. SCALE reinvests that operating cash flow into new development identified through geological and production data analysis.
Turning that framework into results falls to Luke McIntosh, VP of Asset Intelligence & Performance, who translates raw operational and production data into insights that guide ongoing optimization decisions across the portfolio.
His work pairs directly with the acquisition and development side of the business, led by President & COO Blaine Yeary. Yeary previously scaled a $5 billion asset from zero to 35,000 BOEPD over eight years.
The results carry third-party validation, not just internal reporting:
- $48MM proved reserves valuation (PV-09), engineered by a licensed third-party firm
- 33% EBITDAX-positive operations, exceeding quarterly plan by 33%
- ~1,300 BOEPD across roughly 400 wells and 58,000 acres in South Texas and the Gulf Coast Basin
That combination of protected legacy production and third-party-verified performance is what accredited investors gain access to through PetroVybe's direct partnership structure, available starting at $100,000 in liquidity. Learn more about partnering with PetroVybe.
Frequently Asked Questions
What does asset optimization mean?
Asset optimization means maximizing the performance, availability, and lifespan of assets already in service while minimizing operating costs. It's about running current assets at peak efficiency, not acquiring new ones.
What are the techniques for asset optimization?
Core techniques include predictive and condition-based monitoring, production optimization (artificial lift, choke management, workovers), data centralization, and criticality-based resource allocation across a portfolio.
What is the difference between asset optimization and asset management?
Asset management covers the full lifecycle : acquisition, development, production, and disposal. Asset optimization focuses specifically on maximizing the current in-service performance of assets already owned.
What KPIs are used to measure asset optimization?
Key KPIs include production rate trends (BOEPD), LOE per BOE, uptime/availability, actual output versus decline curve, and profitability measures like EBITDAX, MOIC, and IRR.
Why is asset optimization important in oil and gas development?
Wells and midstream infrastructure require significant upfront capital. Optimization protects that investment by minimizing downtime, sustaining production, and directly defending investor returns against natural decline.
How does asset optimization affect investor returns?
Well-level efficiency gains and cost reductions roll up into portfolio-level EBITDAX growth. That growth directly drives the MOIC and IRR figures that determine actual investor returns over a project's hold period.