
Introduction
Most people picture wealth as a smooth ladder: climb high enough, and eventually you're rich. That picture is wrong.
Wealth actually behaves like a segmented pyramid, and the rules change completely depending on which tier you occupy. The retail base gets efficient, low-cost tools, while the ultra-wealthy apex gets custom architecture built around their specific goals.
Everyone in between? They're stuck paying premium prices for advice that barely outperforms a robo-advisor.
Only 10% of U.S. adults, roughly 23.8 million people, have crossed the $1 million net worth line, according to UBS's Global Wealth Report. Yet crossing that line doesn't guarantee better treatment; in many cases, it guarantees worse.
This guide breaks down all three tiers of the wealth hierarchy, explains why the middle gets squeezed on fees and taxes, and lays out specific strategies for escaping it.
Key Takeaways
- Wealth tiers depend on control, access, and tax optimization, not net worth alone
- A small slice of households controls a disproportionate share of U.S. wealth
- The HNW/UHNW middle often pays top-bracket taxes yet receives mass-market advice
- Escaping the middle requires direct, tax-advantaged assets, not more accumulation
- Fee layering erodes returns over decades, even when each fee looks small
What Is the Wealth Hierarchy?
The wealth hierarchy is a layered structure that determines which financial strategies, tax tools, and access levels you actually qualify for. Net worth is one input, but it's not the deciding factor.
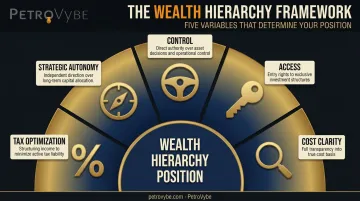
Your real position depends on five variables:
- Control: Do you own direct stakes, or do you hold shares in pooled products managed by someone else?
- Access: Can you get into institutional-grade deals, or only retail-facing funds?
- Cost clarity: Do you know exactly what you're paying, or is it buried in layers?
- Tax optimization: Are you using every legal tool available, or just the standard ones?
- Strategic autonomy: Are you designing your financial system, or consuming someone else's product?
Two people with identical $3 million net worths can sit in completely different tiers depending on how they answer those five questions. One person might be efficiently compounding through low-cost index funds. Another might be paying three layers of fees on a private fund they don't fully understand.
That variability is what creates the hierarchy itself. Three broad tiers emerge:
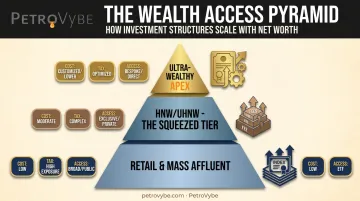
- Retail and mass-affluent: standard brokerage accounts, mutual funds, and off-the-shelf tax advice
- HNW/UHNW: access to private placements, dedicated advisors, and more sophisticated tax structures
- Ultra-wealthy apex: direct ownership, custom entities, and strategies built around control rather than off-the-shelf products
Each tier plays by a different rulebook, which the next section unpacks in detail.
The Three Tiers of the Wealth Pyramid Explained
Each tier operates under distinct investment, cost, and tax rules. Misunderstanding your tier can mean overpaying for advice and taxes regardless of how much you're actually worth.
Tier 1: The Base - Retail Investors & Mass Affluent
This tier runs on efficiency. Most investors here use low-cost index funds, ETFs, and robo-advisors built around a standard 60/40 allocation.
The math works in their favor:
- Index equity mutual funds average roughly 0.05% in annual fees
- Index ETFs run about 0.10%–0.14%
- Robo-advisors charge a median advisory fee of 0.25%
- Access to tax-sheltered accounts (401(k)s, IRAs) shields growth from annual taxation
According to Federal Reserve wealth distribution data, the bottom 50% of U.S. households hold just 2.5% of total household wealth, while the next 40% (the 50th to 90th percentile) hold 29.6%. In other words, roughly 90% of households control about a third of the country's wealth.
That's a modest share, but an efficient one: low fees mean more of the market's return actually reaches the investor.
Tier 2: The Middle - HNW & UHNW ("The Squeezed Tier")
This is where things get complicated. High-net-worth (HNW) status generally starts around $1 million in investable assets, per Capgemini's World Wealth Report, while ultra-high-net-worth (UHNW) status kicks in around $30 million. Knight Frank uses similar thresholds but measures total net worth instead of investable assets, which matters because the two definitions produce different population counts.
By late 2025, Capgemini counted roughly 8.7 million U.S. HNWIs. Knight Frank separately tracked 225,077 U.S. UHNWIs in 2023. This tier includes:
- High-earning professionals (doctors, executives, attorneys)
- Successful entrepreneurs who sold a business
- Second-generation inheritors managing family wealth
The investment experience here often looks impressive but performs poorly. Tier 2 investors get access to "exclusive" private funds and feeder structures, but those structures usually stack an advisory fee on top of the underlying fund's own fee. You end up paying twice for access that doesn't necessarily outperform a simple index strategy.
The tax picture compounds the problem. This tier clears standard exemption thresholds but lacks access to the elite international structuring available to the apex. Meanwhile, high active income, capital gains, and estate taxes hit with limited relief.
The numbers back this up. Tax Foundation data shows the top 10% of earners paid 72.0% of all federal individual income tax in 2022, at an average rate of 21.11%. The top 1% paid 40.4% at 26.09%. Many Tier 2 households sit squarely inside these brackets: they owe serious tax without qualifying for the structuring that would reduce it.
That's the core paradox: this tier gets taxed like the rich but advised like the retail base. The gap between those two realities is where returns erode year after year.
This is precisely the gap that direct, tax-advantaged investments close: partnerships such as PetroVybe's oil and gas development program let active income earners claim upfront intangible drilling cost deductions that most Tier 2 portfolios never touch.
Tier 3: The Apex - Billionaires & Family Offices
At the top, the entire model shifts from "wealth management" to wealth architecture. Instead of buying products, the apex builds systems.
Key differences include:
- Co-investments and direct equity stakes instead of pooled fund shares
- In-house analysts and negotiated costs instead of fee-layered products
- Multi-jurisdictional structuring, trusts, foundations, and residency arbitrage
Forbes counted 989 U.S. billionaires on its 2026 list, while UBS separately tracked 924 U.S. billionaires holding a combined $6.9 trillion, with 74% self-made. Either way, this is an extremely small population controlling an outsized share of national wealth.
Family offices reflect this apex mindset. According to RBC and Campden Wealth's 2024 report, operating costs for offices managing $1 billion or more averaged 42 basis points, compared to 98 basis points for offices under $500 million. Scale itself becomes a cost advantage.
Elite tax engineering, built through legal entities most Tier 2 investors have never heard of, often produces a lower effective rate than what the "squeezed" middle pays on ordinary income.
Tier Comparison at a Glance
| Factor | Tier 1: Base | Tier 2: Middle | Tier 3: Apex |
|---|---|---|---|
| Typical fee load | 0.05%–0.25% | Layered (advisory + fund) | Negotiated, direct |
| Tax exposure | Sheltered accounts | Full active/capital gains exposure | Multi-jurisdictional structuring |
| Investment access | Index funds, ETFs | Feeder funds, private placements | Direct equity, co-investments |
| Core advantage | Cost efficiency | Neither efficiency nor structuring | Control and custom design |
Why the Middle Tier Gets Squeezed
The squeeze isn't an accident. It's baked into how financial institutions and governments generate revenue.
Financial institutions profit most from locking Tier 2 capital into fee-generating products. Retail investors don't have enough assets to justify custom service, and the apex negotiates fees down to almost nothing. That leaves Tier 2 as the profit center: big enough to matter, not powerful enough to push back.
Governments follow a similar pattern. Active income earners in Tier 2 generate a disproportionate share of tax revenue. Their income is visible, reported on W-2s and 1099s, and difficult to shelter compared to the capital-gains-heavy, entity-structured income common at the apex.
Fee Layers Compound Quietly
The SEC's own investor education materials illustrate the damage. On a $100,000 investment growing at 4% annually over 20 years:
- A 0.25% annual fee leaves roughly $208,000
- A 0.50% fee leaves roughly $198,000
- A 1.00% fee leaves roughly $179,000
That's a $29,000 gap between the cheapest and most expensive scenario, on a single fee layer. Now stack an advisory fee on top of a fund fee on top of a platform charge. That's exactly the structure many Tier 2 portfolios carry, and the compounding drag becomes significant over a 20 or 30-year horizon.
Three Different Growth Engines
Each tier compounds wealth differently:
- The base compounds through efficiency: low fees, tax-sheltered accounts, and time in the market
- The apex compounds through control: direct ownership, negotiated terms, and structural tax advantages
- The middle bleeds through opacity: paying for access it doesn't fully understand, without the leverage to negotiate better terms
Net worth alone doesn't fix this. A person with $5 million can still be playing the wrong game if their money sits in fee-heavy feeder funds with no tax optimization and zero strategic autonomy. The structure underneath that number determines whether the wealth compounds or quietly erodes.
How to Move From Client to Owner: Escaping the Middle Tier Squeeze
Escaping Tier 2 means changing how you interact with the system, not accumulating more assets. Here's a practical sequence.
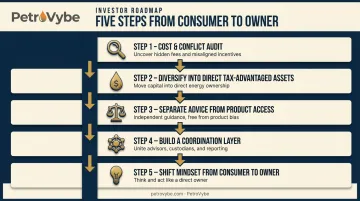
Run a full cost-and-conflict audit. Pull every statement and identify embedded advisory fees, fund expense ratios, commissions, and platform charges. Most investors have never added these up in one place. Once you see the total, the case for change becomes obvious.
Diversify into direct, tax-advantaged alternative assets. Traditional stocks, bonds, and real estate all carry standard tax treatment. Certain accredited-investor vehicles work differently. Natural gas development programs, for example, can generate substantial upfront tax deductions against active W-2 or capital gains income, alongside long-term passive income potential.
PetroVybe's structure illustrates this well, with Intangible Drilling Cost (IDC) deductions producing substantial write-offs for partners:
- IDC deductions typically represent 60–80% of invested capital in new drilling projects
- 2024 partners received a 91% tax deduction against active income
- 2025 partners received a 94% tax deduction against active income
Unlike most real estate deductions, IDCs aren't restricted to passive income. They apply directly against W-2 wages and capital gains. For accredited investors with $100,000+ in liquidity, this is a tool historically reserved for institutions and insiders, not something available through a standard brokerage account.
Separate advice from product access. Bundled advisor-distributor models create a built-in incentive to sell you their firm's products. Fee-only or independent advisors get paid the same amount regardless of what you invest in, which removes that conflict entirely.
Build a lightweight coordination layer. Even a part-time function, whether that's you or a hired coordinator, that oversees multiple advisors and asset classes against one unified strategy beats managing everything in disconnected silos.
Shift your mindset from consuming products to designing a system. This is the single behavioral difference that separates the apex from the middle. The apex doesn't ask "what product should I buy?" They ask "what does my portfolio need, and who can build that piece for me?"
None of this requires billionaire-level assets, just treating your capital like an owner rather than a client.
Frequently Asked Questions
What is the hierarchy of wealth?
It's a layered pyramid, not a smooth spectrum. Investment strategy, cost structure, and tax treatment differ sharply across the retail base, the HNW/UHNW middle, and the ultra-wealthy apex.
How many Americans have a net worth over $1,000,000?
Roughly 23.8 million U.S. adults, or about 10% of the adult population, had a net worth of at least $1 million at year-end 2024, according to UBS.
What net worth is considered high-net-worth versus ultra-high-net-worth?
Industry benchmarks typically place HNW status around $1 million in investable assets and UHNW status around $30 million, though exact definitions vary by source (net worth versus investable assets).
Why do middle-tier investors often pay more in fees and taxes than the ultra-wealthy?
The middle lacks the scale for custom infrastructure and the access needed for elite tax structuring, resulting in layered fees and full exposure to active income and capital gains taxes.
Can average or middle-tier investors access strategies used by the ultra-wealthy?
Full family-office infrastructure isn't realistic for most investors. Tools like fee audits, unbundled advice, and direct-access alternative investments still let the middle tier adopt an owner's mindset.
How can alternative investments like oil and gas development help with this tax and wealth imbalance?
Certain direct energy development programs, such as PetroVybe's oil and gas partnerships, offer Intangible Drilling Cost deductions that apply against active income, not just passive income, giving accredited investors a tax tool typically unavailable through retail products.