
Many investors default to net income when judging a company's health. That's a mistake. Net income includes non-cash accounting entries and can mask serious cash shortages. Poor reliance on this single number leads to bad investment calls and misplaced confidence in dividend safety.
This guide breaks down what OCF is, how to calculate it using both accepted methods, how it compares to free cash flow (FCF) and other metrics, and why it matters when evaluating cash-flowing investments, including capital-intensive sectors like natural gas development.
Key Takeaways
- OCF measures cash generated from core operations, excluding investing and financing activities
- Two calculation methods exist: indirect (adjusts net income) or direct (cash receipts minus expenses)
- Positive OCF means a company can self-fund without outside debt or equity
- FCF differs from OCF by further subtracting capital expenditures
- The OCF ratio gauges short-term liquidity, especially in capital-heavy industries
What Is Operating Cash Flow (OCF)?
Operating cash flow is the cash a business generates (or burns) through its day-to-day activities: selling products, paying suppliers, covering payroll, and settling taxes. It's reported as the first section of the cash flow statement, sitting above investing and financing activities.
What OCF leaves out matters just as much as what it includes. It excludes:
- Investing activities: capital expenditures, equipment purchases, acquisitions
- Financing activities: debt issuance or repayment, dividends, share buybacks
This separation exists for a reason. Mixing operating cash with a one-time asset sale or a new loan would distort the picture of whether the underlying business actually generates cash.
Why the Distinction Matters
OCF shows whether a company earns enough from its core business to cover operating expenses, taxes, and reinvestment needs, without leaning on outside capital. A business with strong OCF has options. One with weak or negative OCF is often forced to borrow just to stay afloat.
Scale matters here too. Apple's fiscal year 2025 10-K filing reported $111.482 billion in cash generated from operating activities, actually slightly below its $112.010 billion net income, illustrating that even a wildly profitable company can see cash run below reported earnings once non-cash items and working capital shifts are accounted for (Apple FY2025 SEC filing).
Within the full cash flow statement, OCF sits alongside two other sections:
- Investing activities: asset purchases, sales, and capital projects
- Financing activities: debt, equity, and shareholder distributions
Together, all three sections combine to explain the change in a company's cash balance over the period.

How to Calculate Operating Cash Flow
Accountants use one of two accepted approaches to arrive at OCF. Both must produce the identical final number, though they arrive there through different paths.
Indirect Method
This is the formula most companies use:
OCF = Net Income + Non-Cash Expenses – Increase in Net Working Capital
Common non-cash add-backs include:
- Depreciation & amortization: expensed on the income statement but never actually paid in cash
- Stock-based compensation: a real expense, but settled in equity, not cash
- Deferred taxes: reverses the non-cash portion of tax expense (add back deferred tax expense; subtract a deferred tax benefit)
- Impairment charges: write-downs of asset value that lower net income without any cash leaving the business
Working capital changes cut the other way: rising receivables or inventory reduces OCF because cash gets tied up, while rising payables or accrued expenses increases OCF because cash is retained longer.
Apple's own FY2025 reconciliation shows this in action: $11.698 billion in D&A and $12.863 billion in stock-based comp were added back, while a $6.682 billion increase in accounts receivable was subtracted (Apple FY2025 SEC filing).
Direct Method
The direct method takes a more literal approach:
OCF = Cash Receipts – Cash Operating Expenses Paid
Instead of starting from net income, it sums actual cash collected from customers and subtracts cash paid to suppliers, employees, and other operating expenses. FASB actually encourages companies to use this method because it's more transparent, showing real cash inflows and outflows by category. In practice, most U.S. companies stick with the indirect method instead, simply because the data is easier to pull from existing financial statements.
Worked Example
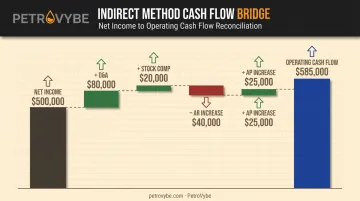
Here's a simplified walk-through using the indirect method:
| Line Item | Amount |
|---|---|
| Net Income | $500,000 |
| + Depreciation & Amortization | $80,000 |
| + Stock-Based Compensation | $20,000 |
| – Increase in Accounts Receivable | ($40,000) |
| + Increase in Accounts Payable | $25,000 |
| Operating Cash Flow | $585,000 |
Notice how OCF ends up higher than net income here, driven by non-cash add-backs outweighing the working capital drag. That $85,000 gap shows why analysts treat net income alone as an unreliable cash indicator.
Operating Cash Flow vs. Free Cash Flow (and Other Metrics)
OCF is useful, but it's not the whole story. Several related metrics blur together constantly, and knowing the difference changes how you evaluate a business.
Free cash flow (FCF) takes OCF one step further:
FCF = OCF – Capital Expenditures
CapEx is the differentiator. A company can post strong OCF while spending heavily on new equipment or facilities, leaving little discretionary cash behind.
Using Apple's FY2025 figures again: $111.482 billion OCF minus $12.715 billion in property and equipment purchases leaves $98.767 billion in free cash flow — a meaningful gap that only shows up once CapEx enters the picture.
Net income differs from OCF because accrual accounting recognizes revenue and expenses on timing rules that have nothing to do with when cash actually moves. Depreciation, revenue recognition schedules, and working capital timing can push OCF above or below net income in any given period.
EBITDA gets lumped in with cash flow metrics too, but it isn't one. It excludes interest and taxes, sure, but it also ignores working capital changes entirely. A company can show glowing EBITDA while losing cash because customers aren't paying on time.
Here's how the four stack up side by side:
| Metric | Formula/Basis | What It Shows | Key Omission |
|---|---|---|---|
| OCF | Net income + non-cash items ± working capital | Cash from core operations | No CapEx deducted |
| FCF | OCF – CapEx | Discretionary cash after capital spending | Definitions of CapEx can vary |
| Net Income | Revenue – all expenses (accrual basis) | Accounting profitability | Not actual cash |
| EBITDA | Net income + interest + taxes + D&A | Pre-financing earnings | Ignores working capital and CapEx |
Each metric answers a different question. Use OCF to check whether operations generate cash. Use FCF to see what's left after reinvestment. Use net income for accrual-based profitability. Don't use EBITDA as a cash flow substitute, no matter how tempting the number looks.
Why Operating Cash Flow Matters for Investors
For investors, OCF isn't an academic exercise. It's a direct read on:
- Liquidity — can the company cover near-term obligations without scrambling for financing?
- Debt-servicing capacity — is there enough cash to make interest and principal payments?
- Distribution sustainability — are dividends or partner distributions backed by real cash, or funded by debt?
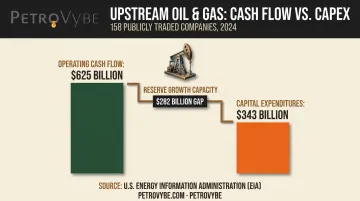
This matters most in capital-intensive industries, where reinvestment cycles are constant. In the oil and gas sector specifically, a sample of 158 publicly traded upstream companies generated $625 billion in operating cash flow during 2024.
That output compares to $343 billion in capital expenditures for the same group, according to the U.S. Energy Information Administration (EIA 2024 Financial Review). The gap between OCF generated and CapEx spent fuels reserve growth.
PetroVybe applies this principle directly. Rather than distributing every dollar of operating cash flow immediately, the company blends multiple funding sources to fuel new drilling:
- Partner equity contributed by accredited investors
- Credit facilities for operational flexibility
- Reinvested operating cash flow funneled back into new wells
This approach follows PetroVybe's internal PROTECT and SCALE framework: first acquiring legacy producing assets to establish a cash-flowing base, then reinvesting that cash into new wells identified through geological data.
Its Lavaca County, Texas project, PetroVybe ONE, carries a third-party engineered $48 million proved reserves valuation, built in part through this reinvestment cycle.
There's also a tax dimension to this cash flow story. Operating expenses in oil and gas development, particularly intangible drilling costs (IDCs), often carry significant deductibility against active income.
PetroVybe partners who joined in 2024 reported a 94% deduction against active income; 2025 partners reported 91%, according to internal partner reporting. For accredited investors managing high W2 income or capital gains exposure, that tax treatment adds a layer of value beyond the operating cash flow itself.
Operating Cash Flow Ratio: A Quick Liquidity Check
Want a fast way to gauge whether a company can cover its short-term obligations using cash alone? Calculate the operating cash flow ratio:
Operating Cash Flow Ratio = Operating Cash Flow ÷ Current Liabilities
Interpretation is straightforward:
- Above 1.0: the company generates enough cash from operations to cover current liabilities without added financing
- At 1.0: cash from operations exactly matches current liabilities, leaving no cushion for unexpected costs
- Below 1.0: potential liquidity risk; the business may need external funding to meet short-term obligations
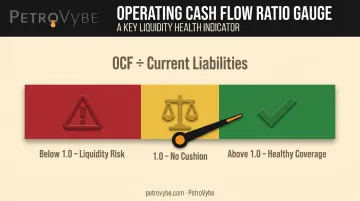
A ratio above 1.0 is generally viewed favorably by analysts and creditors, though it's a rule-of-thumb benchmark, not a guarantee of financial health (CFI Operating Cash Flow Ratio Template).
Quick example: A company reports $2 million in OCF and $1.5 million in current liabilities.
$2,000,000 ÷ $1,500,000 = 1.33
That 1.33 ratio suggests the company can cover its current liabilities from operations alone, with cash to spare. Compare this ratio across several quarters and against industry peers rather than judging it in isolation, since seasonal businesses can swing significantly period to period.
Frequently Asked Questions
What is operating cash flow?
Operating cash flow (OCF) is the cash generated from a company's core business activities, like selling products and paying operating expenses. It excludes cash tied to investing (CapEx) and financing (debt, dividends) activities.
How is operating cash flow calculated?
It's calculated using the indirect method (net income + non-cash items – change in net working capital) or the direct method (cash receipts – cash operating expenses). Both must arrive at the same final figure.
What is the difference between FCF and OCF?
Free cash flow subtracts capital expenditures from operating cash flow, showing what's left after a company reinvests in equipment and facilities. OCF alone doesn't account for that reinvestment.
Why is positive operating cash flow important?
Positive OCF shows a company can fund operations, service debt, and grow without depending on outside loans or equity raises. This gives management more flexibility to reinvest profits or return capital to shareholders without diluting ownership.
What is a good operating cash flow ratio?
A ratio above 1.0 is considered healthy, meaning the company can cover current liabilities from operating cash alone. It's a useful benchmark, not an absolute standard.
Does operating cash flow include taxes?
Yes. OCF accounts for cash taxes actually paid during the period, which distinguishes it from pre-tax profitability metrics like EBITDA.