
Fitch Ratings has stated that its corporate analysis gives "substantially more weight" to cash flow measures of earnings, coverage, and leverage than to equity-based ratios like debt-to-equity or debt-to-capital. The Office of the Comptroller of the Currency goes further, naming cash generation the primary repayment source in leveraged lending — ahead of refinancing or asset sales.
That distinction hits hardest in capital-intensive, cyclical industries like oil and gas development, where accounting profit can look fine on paper while actual cash generation lags behind debt obligations. Here's how the cash flow coverage ratio works, how to calculate it, and what the results tell lenders, investors, and operators about real solvency risk.
Key Takeaways
- CFCR measures operating cash flow against total debt, not accounting profit
- Formula: Operating Cash Flow ÷ Total Debt; below 1x means debt exceeds operational cash generation
- Banks, bond covenant analysts, and private investors all check this before committing capital
- A free cash flow variant subtracts capex for a stricter, more conservative view
- No universal "good" number exists — benchmark against same-industry peers and multi-period trends
What Is the Cash Flow Coverage Ratio?
The cash flow coverage ratio is a solvency metric. It measures how many times a company's operating cash flow could pay off its entire outstanding debt balance if applied in full.
Analysts and lenders use it in a few distinct settings:
- Bank credit underwriting: sizing loan terms, interest rates, and covenants around actual repayment capacity
- Bond covenant analysis: monitoring whether an issuer maintains sufficient cash generation over the life of the debt
- Private investment due diligence: a step accredited investors should apply to any private development opportunity, not just public companies
- Internal financial planning: management teams tracking whether growth plans outpace cash generation
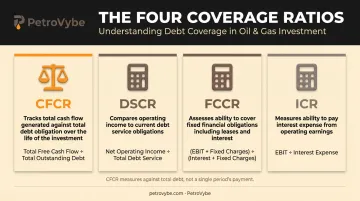
CFCR gets confused with other coverage ratios constantly, so here's how they actually differ:
| Ratio | What It Measures | Formula Structure |
|---|---|---|
| CFCR | OCF relative to entire debt balance | OCF ÷ Total Debt |
| Debt Service Coverage Ratio (DSCR) | Cash available relative to scheduled principal + interest for the period | Net Operating Income ÷ Total Debt Service |
| Fixed Charge Coverage Ratio (FCCR) | Cash/earnings relative to negotiated fixed obligations (interest, leases, amortization) | (EBITDA − CapEx − Cash Taxes) ÷ (Cash Interest + Amortization) |
| Interest Coverage Ratio (ICR) | Operating earnings relative to interest expense only | EBIT ÷ Interest Expense |
The key difference: CFCR's denominator is the entire debt balance, not a single period's scheduled payment. That makes it a longer-horizon solvency check, while DSCR answers a narrower question: can this company make its next payment?
Why the Cash Flow Coverage Ratio Matters
This isn't an academic exercise. CFCR feeds directly into loan pricing, covenant structure, and how much risk a lender or investor is actually taking on.
- Improves decision quality: Lenders use it to set loan terms, covenants, and interest rates based on demonstrated repayment capacity, not projected earnings.
- Reduces risk and uncertainty: A strong ratio signals a business can absorb a temporary earnings slowdown without tripping into default.
- Signals distribution capacity: Shareholders and limited partners use it to judge whether a company can sustain or grow payouts after debt is covered.
- Supports long-term capital planning: This is especially critical in oil and gas, where production and commodity price cycles create earnings volatility even when underlying cash generation stays healthy.
There's no single "good" number
CFI and Investopedia both make the same point: CFCR needs to be judged against same-industry peers, not a universal cutoff. Capital intensity, typical debt loads, and reinvestment cycles vary too widely across sectors for one benchmark to apply everywhere.
For context, the OCC's oil and gas lending guidance references a related leverage covenant (debt divided by trailing EBITDAX) commonly capped between 3.5x and 4.0x in E&P loan agreements. That's a different metric than CFCR, but it illustrates how heavily lenders lean on cash-flow-anchored covenants in this sector specifically.
How to Calculate the Cash Flow Coverage Ratio
There are two ways to approach this calculation, depending on what data you have and how conservative you want to be.
Formula 1 (primary):
CFCR = Operating Cash Flow ÷ Total Debt
This is the standard used by Wall Street Prep's cash flow coverage ratio framework, pulling directly from the cash flow statement.
Formula 2 (a rougher proxy): Some analysts substitute EBIT plus depreciation and amortization for OCF when a cash flow statement isn't readily available. This figure is mathematically identical to EBITDA.
It's a less reliable stand-in, though: it ignores real cash consumed by inventory purchases and working capital swings. Treat it as a quick estimate, not a replacement for the OCF-based version.
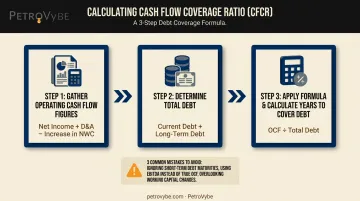
Step 1 – Gather Operating Cash Flow Figures
Pull net income, D&A, and the change in net working capital from the statement of cash flows:
OCF = Net Income + D&A − Increase in Net Working Capital
Step 2 – Determine Total Debt
Add every debt obligation on the balance sheet:
- Current debt (due within 12 months)
- Non-current/long-term debt
Step 3 – Apply the Formula and Calculate Years to Cover Debt
Divide OCF by total debt to get your ratio. Then flip it: 1 ÷ CFCR = years needed to retire all debt at the current cash generation rate.
Common mistakes to avoid:
- Using net income instead of OCF (ignores non-cash items and working capital shifts)
- Forgetting to adjust for changes in net working capital
- Mixing short-term and long-term debt inconsistently across periods
Cash Flow Coverage Ratio Example, Interpretation & Benchmarks
Here's a simplified walkthrough for a mid-size operator being evaluated for a development loan.
The numbers:
- Net income: $800,000
- D&A: $600,000
- Increase in NWC: $100,000
- Current debt: $200,000
- Long-term debt: $650,000
- Capital expenditures: $400,000
Formula 1 (OCF-based): OCF = $800,000 + $600,000 − $100,000 = $1,300,000 Total Debt = $200,000 + $650,000 = $850,000 CFCR = $1,300,000 ÷ $850,000 = 1.53x
Formula 2 (EBITDA proxy, for comparison): If EBIT is $900,000, then EBITDA = $900,000 + $600,000 = $1,500,000 Ratio = $1,500,000 ÷ $850,000 = 1.76x
Notice the two methods don't match exactly. That gap is exactly why Formula 1 is the more trustworthy version: it reflects cash actually collected, not a proxy for it.
A CFCR of 1.53x means the company generates enough operating cash to cover its total debt outstanding 1.5 times over in a single period. Years to cover debt = 1 ÷ 1.53 = roughly 0.65 years.
Below 1.0x is a red flag. It means one period's operating cash flow doesn't even match the total debt balance, which typically triggers deeper due diligence, tighter covenants, or renegotiated terms.
The free cash flow variant
For a stricter view, subtract capex before dividing:
FCF = $1,300,000 − $400,000 = $900,000 FCF-to-debt = $900,000 ÷ $850,000 = 1.06x
That's a meaningfully tighter cushion once reinvestment needs are accounted for. It's also the more relevant number for asset-heavy businesses that must keep spending to maintain output, like oil and gas development.
One caveat: track this ratio across multiple periods and against same-industry peers. A single snapshot in a cyclical sector can mislead just as easily as it can inform.
How PetroVybe Applies Strong Cash Flow Discipline
This kind of scrutiny applies well beyond public companies with quarterly filings. Accredited investors should apply the same due diligence before committing capital to any private oil and gas development opportunity.
PetroVybe's operating model is built around two pillars that mirror what CFCR is designed to measure:
- PROTECT — roughly 400 producing wells and 58,000 acres across Lavaca County and the Gulf Coast Basin generate a stable, cash-flowing foundation, reinforced by targeted workovers and optimization
- SCALE — PetroVybe only deploys new drilling capital where risk-adjusted returns justify it, guided by production data and continuously refined underwriting
Third-party licensed engineering firms have independently validated the company's proved reserves at $48MM (PV-09). That's the kind of external verification lenders and serious investors expect before trusting any cash flow projection.
PetroVybe also reports operations running 33% EBITDAX-positive, exceeding its most recent quarterly plan by the same margin. This combination of a cash-generating legacy asset base and disciplined reinvestment lets an operator compound output, protect investor distributions, and pursue long-term MOIC and IRR targets even through commodity price cycles.

Frequently Asked Questions
How do you calculate cash flow cover?
Divide operating cash flow by total debt (current plus long-term). Some analysts use an EBIT + D&A proxy when a cash flow statement isn't available, though it's a rougher estimate.
How to calculate free cash flow coverage ratio?
Subtract capital expenditures from operating cash flow first, then divide by total debt. This gives a more conservative view since it accounts for reinvestment needs before measuring debt coverage.
What is cash flow coverage?
It's a liquidity and solvency ratio measuring how well a company's operating cash flow can meet its total debt and fixed obligations, rather than relying on accounting profit alone.
What does a cash flow coverage ratio less than 1 indicate?
It means the company's operating cash flow for the period doesn't cover its total debt balance. That typically raises default risk concerns and triggers closer lender scrutiny.
What is considered a good cash flow coverage ratio?
A ratio above 1x is generally healthy, with higher multiples signaling a stronger buffer. There's no universal benchmark, though, since it varies by industry capital intensity.
How does the cash flow coverage ratio differ from the debt service coverage ratio?
CFCR measures coverage of the entire outstanding debt balance. DSCR measures coverage of scheduled debt service (principal plus interest) due within a specific period.