
Asset Liability Management (ALM) was born inside banks, insurers, and pension funds to prevent exactly this scenario. But the underlying logic, matching what you own against what you owe, applies just as much to a business owner managing cash flow as it does to a regional bank managing a $2 billion balance sheet.
This article breaks down what ALM actually means, its core components, how the process works step by step, real examples from banking and pensions, and how individual investors can borrow the same risk-mitigation thinking for their own portfolios.
Key Takeaways
- ALM aligns assets and liabilities by timing, rate sensitivity, and currency to prevent losses
- Institutions continuously monitor four core risks: interest rate, liquidity, FX, and credit
- Net interest margin, gap analysis, and duration modeling are the primary tools measuring exposure
- Individual investors face a similar mismatch between growing tax liabilities and tax-inefficient asset growth
- Tangible, income-producing assets can offset that mismatch better than typical stock and bond portfolios
What Is Asset Liability Management?
Asset Liability Management is the practice of aligning an organization's assets, cash, loans, investments, property, against its liabilities, deposits, debt, and future obligations, so it can meet what it owes without sacrificing profitability. This goes beyond traditional accounting, functioning instead as an ongoing risk discipline that runs continuously across the balance sheet.
The core objective is simple to state and hard to execute:
Have the right assets, in the right amount, available at the right time to cover liabilities as they come due.
When that timing breaks down, whether from illiquid holdings, sudden rate moves, or maturity gaps, the result is a mismatch that can force fire sales, margin compression, or worse.
Who relies on ALM frameworks:
- Commercial banks: manage deposit outflows against long-term loan books
- Pension funds: forecast decades-out benefit obligations against current investment returns
- Insurance companies: match policy payout timing against invested premiums
- Large corporates: align debt maturities and currency exposure with operating cash flow
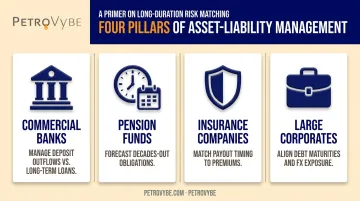
Each of these institutions carries a different asset/liability structure, but the discipline stays the same: it looks forward across the entire balance sheet and never really stops.
That last point separates ALM from general risk management. A department might handle credit risk in isolation, or IT might handle cybersecurity risk on its own. ALM doesn't work that way. It sits above individual departments and looks at the entire balance sheet together, because a rate shift or liquidity crunch rarely stays contained to one silo.
The Reserve Bank of India's ALM guidelines describe this well, defining ALM as a formalized system for measuring, monitoring, and managing liquidity, interest-rate, and exchange-rate risk in a way that's integrated with overall business strategy, not bolted on as an afterthought. It reflects the standard that regulated institutions worldwide, including U.S. banks and insurers, are increasingly held to, and it's a useful bar for anyone thinking about their own financial exposure.
Key Components of an ALM Framework
Every ALM program, regardless of institution size, revolves around a handful of core risk categories. Understanding these gives you the vocabulary to evaluate any balance sheet, including your own.
Interest Rate Risk
This is the risk that comes from funding long-term, fixed-rate assets with short-term, rate-sensitive liabilities (or vice versa). A bank issuing 20-year fixed mortgages funded by short-term deposits is exposed the moment deposit rates rise faster than loan yields adjust.
Banks track net interest margin (NIM), net interest income divided by interest-earning assets, as the headline metric here. It's the clearest signal of whether the spread between what an institution earns and what it pays is widening or shrinking.
Liquidity Risk
Where interest rate risk plays out over years, liquidity risk can strike overnight. It's the danger of being unable to meet cash obligations on time, even if the institution is solvent on paper. An asset-rich, cash-poor balance sheet can still fail if it can't convert holdings to cash fast enough.
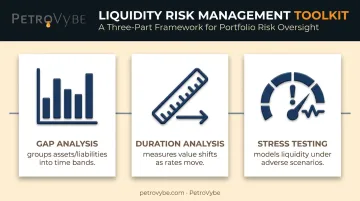
Three tools dominate here:
- Gap analysis — groups assets and liabilities into time bands to compare rate-sensitive amounts maturing in each period
- Duration analysis — measures how the economic value of assets and liabilities shifts as rates move, capturing longer-term repricing risk that gap analysis misses
- Stress testing — models liquidity under adverse scenarios, such as deposit runs or frozen credit markets, to confirm reserves hold up
Currency and Foreign Exchange Risk
Currency mismatches add another layer of exposure: holding assets in one currency while liabilities sit in another creates exposure every time exchange rates move. A US corporate with euro-denominated debt but dollar revenue feels this directly. Institutions typically offset it using FX swaps and forwards rather than carrying the raw exposure on the balance sheet.
Credit Risk and Regulatory Constraints
Counterparty default risk and capital market volatility round out the picture, usually hedged with derivatives, futures, or options.
Regulatory capital requirements layer on top of these exposures. Under Basel III, banks must maintain a Liquidity Coverage Ratio of at least 100%, meaning high-quality liquid assets must cover 30 days of stressed cash outflows. These requirements shape ALM strategy from the ground up.
The ALM Process: How It Works
ALM works as a repeating cycle that most institutions run quarterly, with continuous monitoring in between.
- Assessment: Build a complete inventory of assets and liabilities, including maturity dates, rate sensitivity, and cash flow timing. You can't manage a mismatch you haven't mapped.
- Forecasting and scenario planning: Run stress tests and "what-if" models to see how rate shocks, deposit withdrawals, or market disruptions would hit the balance sheet. This is where institutions catch problems before they materialize.
- Strategy implementation and review: Apply gap management, hedging, and diversification tools based on what the modeling revealed, then revisit the whole framework on a regular cadence as conditions shift.
The cycle never really ends. Markets move, deposit behavior changes, new loans get written, and the balance sheet looks different every quarter. Effective ALM stays active and adaptive, adjusting continuously as the balance sheet changes.
Real-World Examples of Asset Liability Management
Bank Net Interest Margin in Action
Net interest margin tells the story of ALM in real time. In Q1 2024, the FDIC reported that industry-wide NIM fell 10 basis points to 3.17% as deposit competition pushed funding costs up faster than asset yields rose. By Q4 2024, that trend reversed, NIM climbed 5 basis points to 3.28% as funding costs fell faster than earning-asset yields following Fed rate cuts.
The lesson: NIM depends on which side of the balance sheet reprices faster, not simply on whether rates rise or fall overall.
Defined-Benefit Pension Forecasting
A pension plan sponsor owes retirees a fixed benefit decades from now. The plan must forecast today what investment return is needed to meet that obligation, factoring in interest rates and expected equity performance. Get the assumptions wrong, and the plan can end up underfunded just as retirees start drawing benefits.
Asset Coverage Ratio
This metric estimates whether an institution's tangible assets could repay its outstanding debt, roughly calculated as total assets minus intangibles and current liabilities, divided by total debt. It's a quick gut-check on solvency, not a complete ALM strategy, but it's widely used as a supplementary signal.
Public filings from institutions like the Federal Home Loan Bank of Des Moines show this discipline in action. The bank uses swaps, swaptions, caps, and floors to protect market value of equity from large interest-rate swings, reporting compliance with its own policy limits year over year.
Applying Asset-Liability Thinking to Your Personal Investment Portfolio
Individual investors face their own version of this mismatch. Taxable income (your personal "liability") often grows faster than tax-efficient, inflation-adjusted asset growth. Retirement income needs can outpace liquid savings just as easily as a bank's deposits can outpace its loan book's cash generation.
A portfolio concentrated in stocks and bonds addresses market risk reasonably well. It does far less to address tax liability or inflation exposure, two of the biggest "liabilities" most high earners carry.
Diversifying into tangible, income-generating assets addresses both gaps directly. Direct positions in natural gas development, for example, generate real cash flow and carry tax mechanics that stocks and bonds simply don't offer.
PetroVybe's natural gas development partnerships illustrate the concept directly:
- **Upfront tax deduction against active income** — a 94% deduction in 2024 and 91% in 2025, applied against W-2 earnings and capital gains via the Intangible Drilling Cost (IDC) provision, which bypasses standard passive-loss limits.
- Long-term structure — a 10-year hold targeting a MOIC of 2.2x–5.8x and ~26% IRR, with monthly distributions projected to peak above $10,000 per unit during production.
- Accessibility parameters — a $100,000 minimum investment, restricted to accredited investors, with a recommended 7-21 day decision window.

For an accredited investor sitting on a large tax bill or capital gain, this kind of structure functions the same way an ALM framework functions for a bank. It matches an obligation—tax liability, inflation drag—against an asset built specifically to offset it, rather than hoping a generic portfolio absorbs the shock.
Benefits and Challenges of Asset Liability Management
Benefits:
- Greater visibility into how the entire balance sheet behaves under stress
- Improved risk-adjusted profitability rather than growth at any cost
- Better preparedness for rate shocks, withdrawal surges, or market dislocation
Challenges:
- No single framework fits every institution; a pension fund's needs differ sharply from a bank's
- Forward-looking modeling requires data and forecasting capability many organizations still lack
- Effective execution demands coordination across treasury, credit, investment, and risk teams working in unison
PwC's research on insurance ALM modernization found that many insurers still run asset and liability models on separate, disconnected systems, making a unified view genuinely difficult to achieve. Despite that complexity, regulated financial institutions treat ALM as a mandatory, ongoing discipline. The cost of skipping it is far higher than the cost of building it properly.
Frequently Asked Questions
What is asset liability management?
ALM is the practice of matching an organization's assets against its liabilities to reduce financial risk and protect profitability. Banks, pension funds, insurers, and large corporates all rely on it to stay solvent through changing market conditions.
What are the main components of asset liability management?
The core components are interest rate risk, liquidity risk, currency/FX risk, and credit and capital market risk. Regulatory capital requirements also shape how institutions structure their balance sheets around these risks.
What is an example of asset liability management?
A bank managing its net interest margin, the spread between what it earns on loans and pays on deposits, is a classic example. Pension funds forecasting today's required investment returns to meet future benefit obligations is another.
Why is asset liability management important?
Without it, organizations risk liquidity shortfalls or interest rate shocks that can threaten long-term stability. Sound ALM helps prevent the kind of balance-sheet mismatches that have caused bank failures and pension shortfalls in the past.
Who uses asset liability management?
Regulators require formal ALM programs at most banks, insurers, and pension funds, making it a compliance necessity as much as a risk strategy. Individual investors can apply the same logic informally, using it to manage tax liability and inflation risk within their own portfolios.
What is the difference between ALM and general risk management?
ALM is a coordinated, balance-sheet-wide, forward-looking discipline that spans the entire organization. General risk management can be narrower, addressing isolated risks within a single department rather than the full picture.